Capitec Bank: Getting Reading To Sell. Here Are 5 Points You Need To Know - Monday, 08 April 2024
- Lester Davids

- Apr 5, 2024
- 1 min read
READING TIME: 1 MINUTE
Weekly Chart highlighting the potential price path.
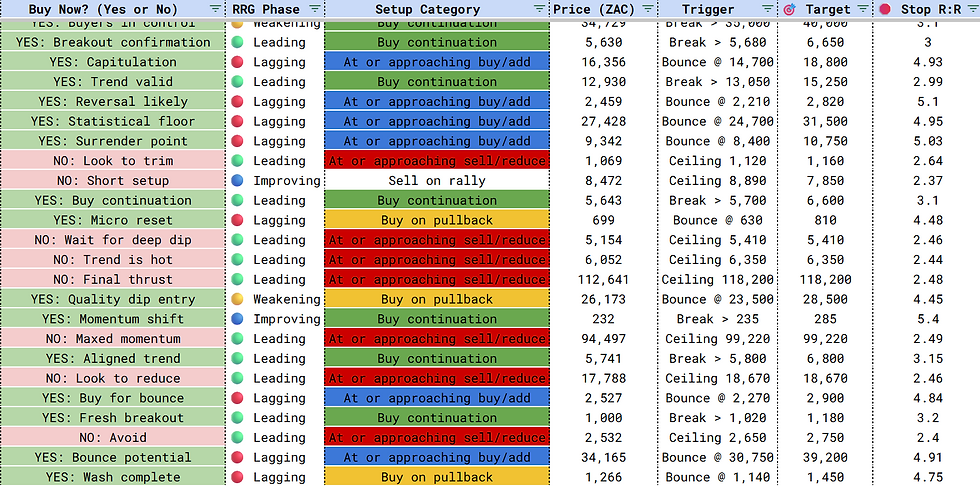
2. The Tactical Trading Guide as of Friday's close.
3. The 7-day Technical Trend Rating shows the share as trading in overbought territory.
4. The 7-Week Technical Trend Rating shows the share as trading in 'high bullish momentum/approaching overbought' territory.
5. A common valuation metric for banks is Price-to-book. As of Friday's close, Capitec trades at 6.48x vs substantially lower levels for it's peer group.
Just under a year ago, Unum Capital clients were alerted to a buy setup (on the weekly chart) which looked for a dip into R1320. The share traded as low as R1330 and has since rallied by 65% to close Friday's session at R2199. The original chart with updated annotations is shown below.
To trade, or open a new account, contact the Unum Capital Trading Desk: E-mail: tradingdesk@unum.co.za | Call: 011 384 2923
Lester Davids
Analyst: Unum Capital


Comments