Research: Insights & Opportunities - Thursday, 28 March 2024
- Lester Davids

- Mar 27, 2024
- 3 min read
To trade, or open a new account, contact the Unum Capital Trading Desk:
E-mail: tradingdesk@unum.co.za | Call: 011 384 2923
Lester Davids
Analyst: Unum Capital
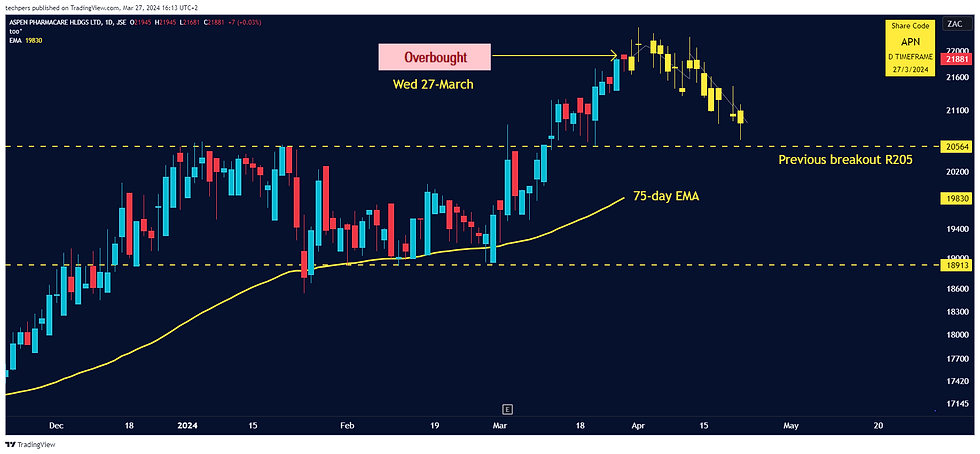
Thursday 28 March 2024, 06h30 | APN Aspen Pharmacare | Tuesday’s close saw the share ranked in OVERBOUGHT territory while yesterday the share also closed in OVERBOUGHT territory (rating unchanged). At current levels, the buy/long side reward-to-risk does not favour new buyers. Should the share fail to hold these range highs, this would st up a short term short/sell trade where a re-test of or near the R205 breakout level would be the target.
Thursday 28 March 2024, 06h30 | SSW Sibanye Stillwater | Potential for a gap fill at 1938c. Also Tactical Trading Guide and see potential price path on chart below:
Thursday 28 March 2024, 06h30 | MTN Group | Strong Bullish Reversal. The share is trading at a 6 week high, with the buy/long alert coming from the automated Tactical Trading Guide as well as a manual view. The declining 75-day EMA could halt short term gains although the share could overshoot this level followed by a minor retracement.
MTN Group | Clients of Unum Capital were previously alerted via the charts below.
Resource Centre: Price Cycle - The Yellow Line is an example which illustrates how a share price can develop over time, moving between the various short term technical ratings.

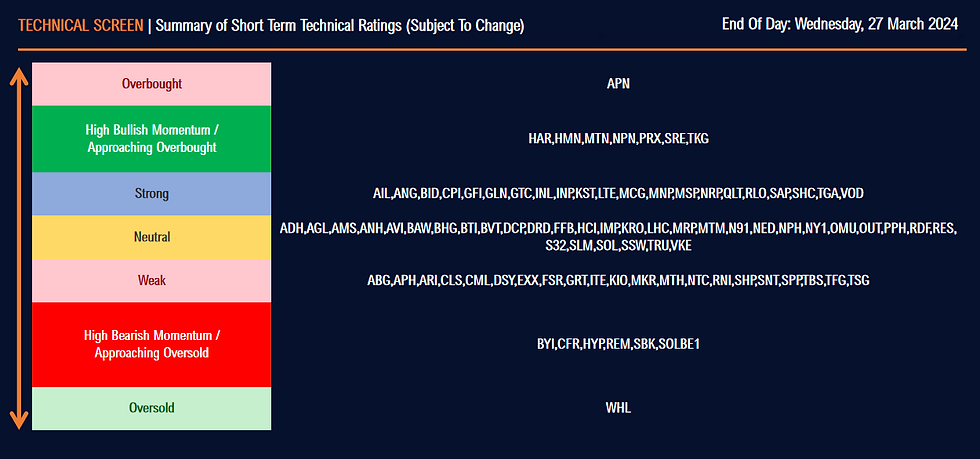
Thursday 28 March 2024, 06h30 | Technical Rating Summary: Mid & Large Caps, as of yesterday's close. Use this table to view which phase a share is in at the last close.
To Access All 90 Shares, Including MTN Group, Spar, Northam Platinum and Truworths, Click On The Following Link: https://www.unum.capital/post/tactical-trading-guide
Thursday 28 March 2024, 06h30 | Candlestick Formations (Buyer/Seller Dominance) form part of technical price charts, which are are used by market participants to interpret current demand-supply dynamics, potential price trends as well as form decisions from these inferences. The tables below highlight the following: (1) The share code (2) the candle's 'change from open’ (over 1 session) i.e. from the start of the first hour of the trading day to the end of the last hour of the trading day'. This is used to determine the strength/weakness of the candle formation i.e. the greater (+) the percentage, the stronger the candle formation and the weaker (-) the percentage, the weaker the candle formation and (3) the share's short term technical rating i.e. which phase the share is in over a 7 day period.
Top 15 (Strongest)
Bottom 15 (Weakest)
Thursday 28 March 2024, 06h30 | NPN Naspers | Strong Rally - The reading from the Tactical Trading Guide was highlighted on Friday 08 March, at the recent lows. See previous comment as well as the original and follow-up charts below:
NPN Naspers Time-Stamped Signal
Lester Davids
Analyst: Unum Capital
3 Trading Tips

Resource Centre
Top Trading Tips: (1) Let The Candle Confirm (Click Here To Read) (2) Failure & Reclaim (Click here To Read) (3) Igniting Bar (Click Here To Read)
Resource Centre (1) Standard Deviation Chartbook Introduction (Click Here) (2) Standard Deviation: Range of Outcomes & Traders Potential Action (Click Here) (3) Optimal Conditions For Bullish & Bearish Trading Setups (Click Here) (4) Core Trading Principles (5) Core Macro Principles
Systematic Insights: Timely Trading Signals Via The Tactical Trading Guide: MTN, MNP, TBS, SBK, DSY, TKG, MTM, HAR, GFI, IMP (Click Here)


Comments