JSE-Listed Miner's Bullish Expansion 🟢 These Are The Risks 🔴
- Lester Davids

- Apr 12
- 3 min read
Research Notes April 2026 > https://www.unum.capital/post/rapril2026
Trade Local & Global Financial Markets with Unum Capital.
To get started, email tradingdesk@unum.co.za
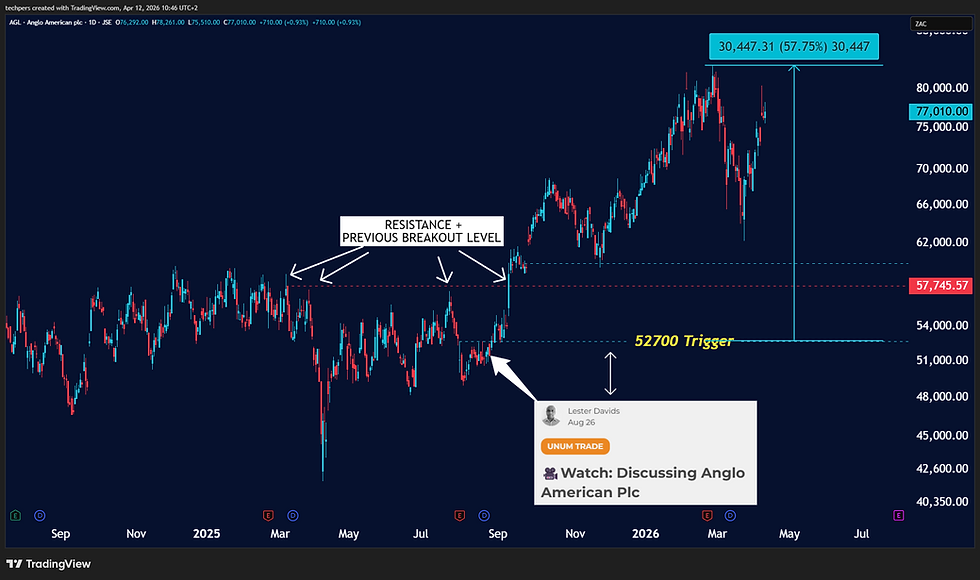
Anglo American Plc (AGL)
Current Phase: 🟢 Buy on Pullback / Trend Continuation
Next Best-Probability Phase: 🟢 Bullish Expansion / Blue Sky Discovery
Strategic Overlay: Trend Continuation.
Tactical Risk Assessment: Buying vs. Selling
What's the risk of buying now? You are initiating a position into a vertical parabolic extension where Daily oscillators are pinned at the overbought ceiling (~84.87). The primary risk is a sharp, algorithmic mean-reversion "flash" pullback to the 70,000c – 72,000c zone to reset tactical indicators before the next leg up.
What Can Change? If institutional buyers maintain the vertical bid and force a weekly close above 82,000c without a pause, it confirms the parabolic phase has entered "Escape Velocity," neutralizing the risk of a near-term dip.
What's the risk of selling now? You are stepping directly in front of a synchronized macro-structural breakout in a diversified mining giant. Shorting when the Monthly Secular Cycle is in a vertical discovery phase often results in being "carried out," as overbought conditions can persist for months during a true regime shift.
What Can Change? If the daily price structure prints a massive "topping tail" on record volume followed by a bearish cross in the fast oscillators, it would mechanically confirm localized exhaustion and a shift to sideways chop.
Forecast Projection Breakdown: With momentum accelerating across all timeframes, the probability distribution is heavily skewed toward immediate continuation.
The Bullish Scenario (60% Probability): The vertical squeeze persists. Buyers absorb all profit-taking and drive the price relentlessly toward 85,000c without allowing a deep pullback.
The Base/Neutral Scenario (25% Probability): The asset hits a localized psychological wall at 80,000c and enters a high-level flag, grinding sideways toward 72,000c to allow moving averages to catch up.
The Bearish Scenario (15% Probability): The breakout is a sophisticated trap. A sudden macro shock forces a high-volume reversal that crashes the stock back into the 67,000c range.

We discussed the share in a video comment on 26 August, with the view that the trigger level would be R527. Subsequently, the share rallied to a multi-month high of R831.
READY TO TRADE: ACTIONABLE AREAS
For active traders who look to generate cash flow on a continuous basis, determining the ‘next best probability’ level to execute against may be of immense value, specifically by helping to determine the best potential times and levels to commit capital.
The blue and red horizontal lines on the chart represent a next-best-probability buy re-entry range and a next-best-probability sell re-entry range over the short term. The ranges assume no existing position is being held by a trader, while the probabilities are based on several factors, which may include:
Short-term ratings and medium-term regimes
Momentum indicators
Horizontal or diagonal support and resistance
Candle structure
Moving averages and standard deviation
Please note that these are short-term levels and may contrast with medium- and long-term outlooks, which are based on the weekly and monthly charts and are generally more applicable to long-term investors. These levels are subject to change based on market sentiment, subsequent price action, and company/sector-specific or macroeconomic news flow. As always, while the levels are outlined to guide your capital deployment, traders should be prepared to adjust in real-time based on the aforementioned factors.
THE TACTICAL TRADING GUIDE (PRICE ACTION MODEL): UNCOVER OPPORTUNITIES & ASSESS REWARD-TO-RISK
It helps helps clients determine and shed light on the some of the following:
The CURRENT TECHNICAL POSITION and a PRICE ACTION PROBABILITY for multiple time frames.
Three (3) ‘trading’ time frames are considered: Short Term (1 to 10 days) / Medium Term (2 to 4 weeks) and Long Term (5 to 8 weeks)
Whether the reward-to-risk is attractive for a buy/long position
Whether a share is weak. In this case, wait until the price stabilizes before looking to enter (i.e. want until it stops going down)
Whether aggressive buying is underway. In this case, do not ‘chase’ (do not buy) but instead wait for a pullback to re-enter a buy or an overextension with deteriorating candle structure to sell/short.
Whether a trader can look to buy a pullback into a key moving average (continuation trade)
Whether a share needs to break a range for a new trend to be determined (bullish or bearish)
Whether a traders needs to monitor for a change of character that could lead to a bullish or bearish reversal
Whether a share could start a consolidation phase or before continuing it’s bullish or bearish trend
Whether the upward momentum is slowing (if it's in a bullish phase)
Whether buyers can look to 'phase in' to a position (if it's in a bearish phase)
Whether a share lacks directional bias.
The data set is available in real-time (on request)
The readings are subject to change as the price action develops.
Lester Davids
Senior Investment Analyst: Unum Capital


Comments