BHP Group: All-Time High. What's The Current Reward-To-Risk?
- Lester Davids

- Jun 2
- 4 min read
Premium Content > https://www.unum.capital/post/premiumcontent
Free Content: June 2026 > https://www.unum.capital/post/rjune2026
Trade Local & Global Financial Markets with Unum Capital.
To get started, email tradingdesk@unum.co.za
Free Content
Note: When published intraday, JSE equity prices are delayed by 15-minutes.
Recommended at R418 on 20 June 2025. Now +R750.
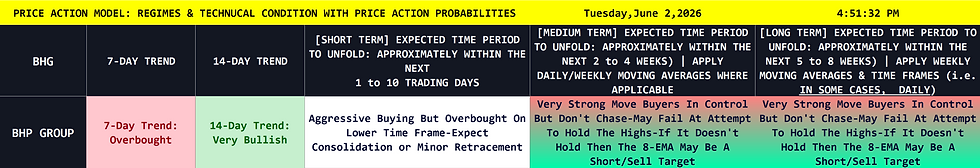
Based on the Weekly Chart for BHP Group Limited (BHG), the reward-to-risk profile has become increasingly complex as the asset enters a parabolic mark-up phase. The upside reward potential is historically strong 🟩 because the stock is trading in clear "blue sky" territory, entirely unburdened by overhead supply or historical resistance. Conversely, the downside risk is elevating 🟥. The market has accelerated so aggressively that the nearest structural support levels are now significantly below current price action, making the asset vulnerable to sharp, mean-reverting pullbacks even within the context of a primary uptrend.

The Last Candle Structure confirms this extreme buying velocity. The current weekly session has formed a massive Bullish Expansion Candle 🟩, opening near its lows and surging to close near its absolute highs with virtually no upper wick. Looking at the Last 5 Candles Structure, we observe a relentless, uninterrupted sequence of bullish advances with expanding ranges, highlighting a total capitulation of sellers. The Last 10 Candles Structure captures the launchpad of this move, showing a decisive breakout from a multi-year consolidation base that immediately transitioned into vertical price discovery 🟩. Zooming out to the Last 3 Months Candle Structure, the asset has experienced an exponential rally, leaving behind a massive technical footprint of sheer institutional demand that has outpaced all recent historical accumulation phases.
The trend’s steepness and slope reflect a market that has gone parabolic. The angle of ascent is highly aggressive, estimated at roughly 80 to 85 degrees on the macro timeframe 🟧. While this confirms that the prevailing trend is undeniably bullish 🟩, such vertical slopes on a weekly chart are rarely sustainable in perpetuity without a period of high-volatility digestion or lateral consolidation to allow moving averages to catch up to the price.
In terms of the Momentum Profile, the indicators signal a profoundly strong but deeply extended macro trend. The Tactical Momentum is currently classified as HIGH BULLISH MOMENTUM / APPROACHING OVERBOUGHT 🟧, reflecting extreme velocity that is nearing the absolute upper bounds of its historical range. Similarly, the Fast Weekly momentum has breached into absolute OVERBOUGHT 🟧 territory, confirming that short-term buyers are paying significant premiums. Moving to the structural timeframe, the Structural Trend momentum is also officially OVERBOUGHT 🟧, a rare condition that underscores the sheer magnitude of this breakout but warns of impending exhaustion. Finally, the Primary Trend momentum has shifted into HIGH BULLISH MOMENTUM / APPROACHING OVERBOUGHT 🟩 territory, confirming that the foundational, long-term cycle is exceptionally strong and fully participating in this historic expansion.
READY TO TRADE: ACTIONABLE AREAS
For active traders who look to generate cash flow on a continuous basis, determining the ‘next best probability’ level to execute against may be of immense value, specifically by helping to determine the best potential times and levels to commit capital.
The blue and red horizontal lines on the chart represent a next-best-probability buy re-entry range and a next-best-probability sell re-entry range over the short term. The ranges assume no existing position is being held by a trader, while the probabilities are based on several factors, which may include:
Short-term ratings and medium-term regimes
Momentum indicators
Horizontal or diagonal support and resistance
Candle structure
Moving averages and standard deviation
Please note that these are short-term levels and may contrast with medium- and long-term outlooks, which are based on the weekly and monthly charts and are generally more applicable to long-term investors. These levels are subject to change based on market sentiment, subsequent price action, and company/sector-specific or macroeconomic news flow. As always, while the levels are outlined to guide your capital deployment, traders should be prepared to adjust in real-time based on the aforementioned factors.
THE TACTICAL TRADING GUIDE (PRICE ACTION MODEL): UNCOVER OPPORTUNITIES & ASSESS REWARD-TO-RISK
It helps helps clients determine and shed light on the some of the following:
The CURRENT TECHNICAL POSITION and a PRICE ACTION PROBABILITY for multiple time frames.
Three (3) ‘trading’ time frames are considered: Short Term (1 to 10 days) / Medium Term (2 to 4 weeks) and Long Term (5 to 8 weeks)
Whether the reward-to-risk is attractive for a buy/long position
Whether a share is weak. In this case, wait until the price stabilizes before looking to enter (i.e. want until it stops going down)
Whether aggressive buying is underway. In this case, do not ‘chase’ (do not buy) but instead wait for a pullback to re-enter a buy or an overextension with deteriorating candle structure to sell/short.
Whether a trader can look to buy a pullback into a key moving average (continuation trade)
Whether a share needs to break a range for a new trend to be determined (bullish or bearish)
Whether a traders needs to monitor for a change of character that could lead to a bullish or bearish reversal
Whether a share could start a consolidation phase or before continuing it’s bullish or bearish trend
Whether the upward momentum is slowing (if it's in a bullish phase)
Whether buyers can look to 'phase in' to a position (if it's in a bearish phase)
Whether a share lacks directional bias.
The data set is available in real-time (on request)
The readings are subject to change as the price action develops.
Lester Davids
Senior Investment Analyst: Unum Capital


Comments