
Copper

Research: October 2026 > https://www.unum.capital/post/roct2026
Disclosure: The commentary below was compiled using an artificial intelligence tool, based on my own data.
Technical Strategy & Insights | Copper Futures | HG1!
Analysis as of Oct 02, 2026 12:12
OVERALL TECHNICAL REGIME RATING: ⭐⭐⭐⭐☆
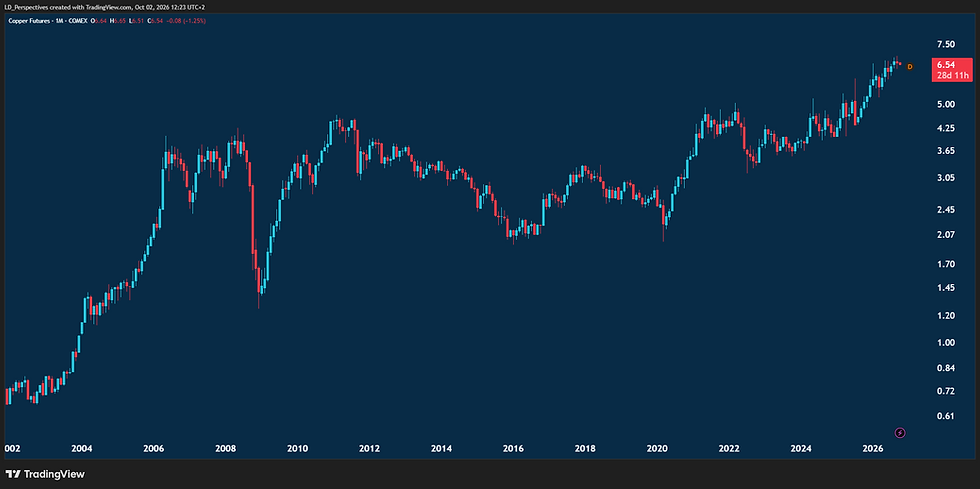
The multi-timeframe structural profile for Copper Futures reveals a premier secular bull market currently working through a healthy intermediate-term digestion phase beneath major psychological resistance. On the long-term monthly horizon, the asset displays a pristine ascending trajectory that has expanded into historic valuation territory, testing major multi-year supply blocks. The intermediate weekly structure captures a constructive consolidation pattern following a powerful impulsive advance, holding near primary structural support baselines. On the daily timeframe, price action has pulled back in an orderly mean-reversion move toward the designated target zone near 6.60, systematically relieving near-term overextended conditions. This multi-timeframe convergence indicates that while immediate upside velocity is paused to absorb overhead supply, the underlying macro trend remains robustly bullish, creating an attractive structural setup for participants anticipating a re-entry near foundational demand.
DAILY CHART TIME FRAME
STRUCTURAL RATING: ⭐⭐⭐☆☆
The reward-to-risk profile is corrective and balancing. For a Buy/Long position, the reward-to-risk is Moderate 🟧 because the asset is actively executing a mean-reversion pullback toward the 6.60 target zone, requiring confirmation of buying exhaustion before establishing a durable low. Conversely, for a Short/Sell position, the reward-to-risk is Poor 🟥 due to the strong underlying institutional support protecting major macro floors, leaving short positions vulnerable to sudden reversal squeezes.
Risks To Entering Buy/Long Positions At Current Levels:
Entering long positions while daily momentum is actively sliding toward neutral can result in immediate drawdown exposure if the pullback overshoots toward deeper support shelves.
Proximity to ongoing short-term selling pressure introduces execution timing risks, as price action may chop sideways before establishing a firm swing bottom.
Risks To Entering Sell/Short Positions At Current Levels:
Initiating short positions into a secular bull market pullback runs counter to the dominant multi-year trend, exposing the portfolio to rapid trend resumption.
The presence of robust structural support just beneath current levels limits downside follow-through, offering poor mathematical reward relative to the risk of a sharp bounce.

The Last Candle Structure indicates active near-term supply absorption, printing a localized consolidation candle as price tests the designated target zone. Looking at the Last 5 Candles Structure, the asset displays a steady downward drift, systematically unwinding prior overbought momentum. The Last 10 Candles Structure captures a controlled pullback from local highs, confirming that the move is an orderly correction rather than structural distribution. Zooming out to the Last 3 Months Candle Structure, the market maintains its broader ascending framework while digesting upper-range boundaries.
The trend’s steepness and slope reflect a short-term corrective correction. The angle of descent is moderate, tracking at roughly 30 to 40 degrees downward 🟥. Consequently, the immediate daily trend has downshifted to structurally Neutral 🟧.
In terms of the Momentum Profile, the oscillators confirm that near-term velocity has cooled significantly. The Short Term momentum is pointing down and is classified as WEAK 🟧 (RSI: 38.18), confirming that the daily trend baseline has successfully discharged its overextended state and is approaching oversold value thresholds.
Tactical Classification: Buy on pullback 🟢
WEEKLY CHART TIME FRAME
STRUCTURAL RATING: ⭐⭐⭐⭐☆
The reward-to-risk profile is constructive. For a Buy/Long position, the reward-to-risk is Appealing 🟩 because the intermediate structure is holding above key moving average baselines, offering a favorable risk posture for macro trend continuation. Conversely, for a Short/Sell position, the reward-to-risk is Poor 🟥 because the robust staircase advance has built a dense series of support floors directly beneath current pricing.
Risks To Entering Buy/Long Positions At Current Levels:
Intermediate long positions taken while weekly momentum consolidates can experience temporary capital drag if the digestion phase extends over several weeks.
Macroeconomic volatility related to industrial demand cycles could trigger deeper intermediate retracements before the next structural leg higher unfolds.
Risks To Entering Sell/Short Positions At Current Levels:
Shorting an intermediate bull trend supported by strong structural higher lows exposes positions to high-probability trend continuation failures.
The lack of weekly distribution evidence means structural sellers cannot rely on macro overhead selling pressure to defend short exposure.
The Last Candle Structure is defensive, forming a minor consolidation candle that reflects standard intermediate profit-taking near the upper target boundary. Looking at the Last 5 Candles Structure, the asset highlights a controlled pause following a strong multi-week push toward resistance. The Last 10 Candles Structure details an orderly accumulation pattern taking shape above major mid-range support. Zooming out to the Last 3 Months Candle Structure, the broader intermediate trend remains structurally sound and upward-sloping.
The trend’s steepness and slope highlight steady capital allocation. The angle of ascent is moderate, tracking at approximately 35 to 45 degrees upward 🟩. Consequently, the intermediate trend is structurally Bullish 🟩.
In terms of the Momentum Profile, the weekly oscillators show balanced directional force. The Tactical Momentum is pointing lateral and is classified as NEUTRAL 🟧 (RSI: 50.86), confirming that the intermediate baseline momentum has completely neutralized its prior stretched condition and is operating in healthy equilibrium.

Tactical Classification: Neutral ⬜
MONTHLY CHART TIME FRAME
STRUCTURAL RATING: ⭐⭐⭐⭐⭐
The reward-to-risk profile remains highly favorable over the secular horizon. For a Buy/Long position, the reward-to-risk is Appealing 🟩 because the asset is anchored by a powerful secular breakout from a multi-year accumulation base, providing massive long-term upside continuation potential. Conversely, for a Short/Sell position, the reward-to-risk is Poor 🟥 due to the complete absence of long-term structural distribution, making short positions catastrophic if the secular trend accelerates.
Risks To Entering Buy/Long Positions At Current Levels:
Long-term macro entries made while the asset tests historical resistance ceilings can be subject to sharp cyclical volatility shakes.
Extended secular valuations can experience multi-month consolidation bands before the primary trend successfully breaches all-time overhead supply blocks.
Risks To Entering Sell/Short Positions At Current Levels:
Shorting a primary secular bull market directly opposes the largest institutional capital flows in the asset class, presenting virtually infinite downside risk.
Structural support floors on monthly timeframes are exceptionally deep, meaning any short-term macro dip is likely to encounter aggressive institutional sponsorship.
The Last Candle Structure shows a steady macro progression, printing a constructive consolidation candle near the apex of the multi-year advance, validating ongoing primary sponsor accumulation. Looking at the Last 5 Candles Structure, the asset captures an expanding secular expansion phase lifting away from prior consolidation bands. The Last 10 Candles Structure illustrates a pristine long-term ascending trajectory born from a massive historical base. Zooming out to the Last 3 Months
Candle Structure (and multi-year view), the price action details a textbook macro mark-up phase testing major upper boundaries.
The trend’s steepness and slope reflect a powerful long-term foundation. The angle of ascent is steady and aggressive, tracking at roughly 45 to 55 degrees upward 🟩. Consequently, the primary trend is structurally Bullish 🟩.
In terms of the Momentum Profile, the long-term indicators demonstrate a robust secular cycle. The Secular Cycle momentum is pointing up and is classified as STRONG 🟩 (RSI: 69.16), confirming that the multi-year structural oscillator retains healthy energy reserves and fully supports ongoing primary expansion.
Tactical Classification: Buy (continuation) 🟦


Comments