
Copper Futures

Research: October 2026 > https://www.unum.capital/post/roct2026
Disclosure: The commentary below was compiled using an artificial intelligence tool, based on my own inputs/data.
🟢 At or Approaching Hold / Range Continuation / Target: 7.1000 / Risk Invalidation: Close below 6.4000
🟢 Macro High Bullish ↔️ Tactical Consolidation ↔️ Trend Continuation / Range Management
Copper Futures [6.7648] are demonstrating resilient structural positioning within an ongoing high-level consolidation phase. Following an advance toward historical macro expansion peaks near 6.9285, price action has successfully defended a crucial intermediate support shelf above the 6.5000 handle. While the Secular (Monthly) momentum engine remains pinned in a robust "High Bullish Momentum / Approaching Overbought" regime, the Strategic (Weekly) engine is holding stable in "Strong" territory. Concurrently, the Tactical (Daily) engine has stabilized into a "Neutral" posture, confirming that short-term corrective pressure has been fully absorbed. The system triggers a Trend Continuation / Range Management reading, establishing an asymmetric framework targeting a continuation toward primary overhead resistance zones.
MOMENTUM PROFILE
Daily Chart (Tactical): Mid Term Momentum is ⬜ NEUTRAL. The tactical engine has consolidated cleanly following its initial pullback, reflecting balanced near-term order flow as price holds key structural support.
Weekly Chart (Strategic): Mid Term Momentum is 🟩 STRONG. The strategic scale remains structurally robust, confirming that the broader intermediate uptrend continues to operate with underlying institutional sponsorship.
Monthly Chart (Macro): Mid Term Momentum is 🟨 HIGH BULLISH MOMENTUM / APPROACHING OVERBOUGHT. The secular engine tracks near major cycle boundaries, validating the dominant long-term bull trend driven by structural supply tightness.
STRUCTURAL BREAKDOWN & VELOCITY
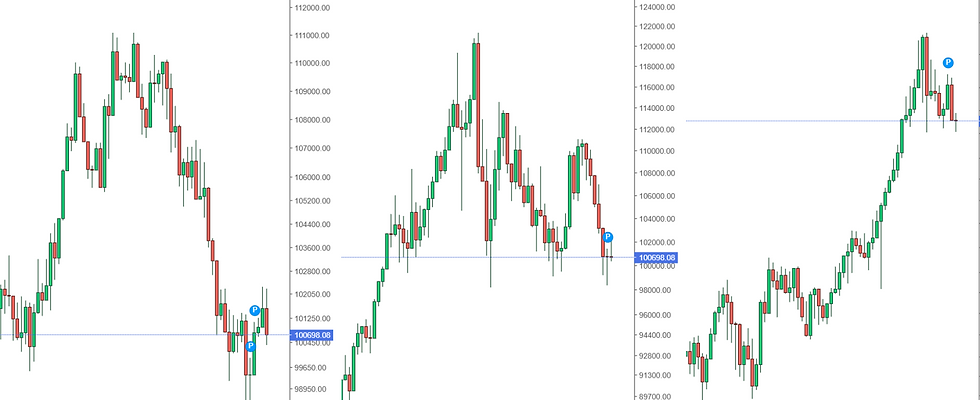
1-Day Structure (Tactical Consolidation): As seen in the daily panel of the session charts, price action has formed a solid horizontal base above the 6.5000 baseline, digesting recent gains with controlled volume.
Weekly Structure (Strategic Mean-Reversion): As displayed in the weekly panel, the intermediate trend shows a healthy, high-level digestion phase following the initial explosive push toward record highs, maintaining a clean upward channel.
Monthly Structure (Macro Reset): As illustrated in the monthly multi-year lens, the broader cycle exhibits a secular expansion phase securely anchored above major historical moving average supports.
CONTRARIAN ASYMMETRY & SUPPORT MAPPING
🟥 Distribution Zone (Tactical Short/Reduce): 7.0000 – 7.1500. The primary overhead supply cluster representing psychological round-number resistance and the upper boundary of the multi-month trading channel.
🔴 Immediate Tactical Support (The Local Pivot): 6.6000 – 6.6600. The immediate horizontal support band acting as the active defensive floor for the current daily base.
🟩 Secondary Support Shelf (The Value Floor): 6.4000 – 6.4800. A high-conviction structural demand zone representing the absolute invalidation boundary for intermediate longs.
🔵 Primary Macro Support (The Secular Floor): 5.8000 – 6.0000. The major generational institutional accumulation shelf safeguarding the primary secular trend.
TECHNICAL VALUATION & VARIANCE MATRIX
Estimated Technical Fair Value (TFV): 6.6500. The volume-weighted center of gravity defining the primary consolidation pivot.
Current Price Premium: The asset trades at a slight premium to its immediate TFV, reflecting persistent supply-side structural premiums in the physical market.
Tactical Upside Potential: +5.0% to +5.5% expansion toward the 7.1000 distribution objective.
Tactical Downside Risk: -5.4% risk down to the strict structural risk invalidation level (6.4000).
Asymmetry Ratio: The mathematical edge favors holding and managing the range inside the immediate support envelope, leveraging strong structural fundamentals against well-defined risk parameters.
TACTICAL PROBABILITY PROFILE
🟢 LONG: Range Support Entry | 70% (Maintaining exposure inside a constructive high-level base supported by strong macro momentum)
🟥 SHORT: Tactical Breakdown | 20% (Low edge to short an asset holding near record-high structural levels without a confirmed macro trend break)
🟢 LONG: Consolidation Retest to 6.5500 | 80% (High-conviction structural entry zone offering optimal risk-defined positioning)
🔵 LONG: Sustained trend above 7.1500 | 60% (Signals formal resolution of the consolidation box and acceleration into a new secular price discovery phase)
CORE THESIS
Copper Futures (HG) are maintaining robust structural integrity within a high-altitude consolidation range. By keeping strategic and macro engines elevated while daily momentum consolidates calmly from local highs, the market continues to offer a stable environment for trend continuation. Forcing short exposure against persistent supply constraints carries an unfavorable mathematical edge. Prudent capital allocation focuses on managing positions near local support floors, targeting an eventual breakout toward the 7.1000 handle.
WHAT CAN CHANGE?
🟦 Bullish Continuation (65% Probability): A high-volume daily close above the 6.8500 threshold will confirm the breakout from the current consolidation box, clearing the path toward the 7.1000 distribution target.
🟥 Structural Breakdown Validation (35% Probability): A decisive weekly close breaking cleanly below the 6.4000 support floor will invalidate the trend continuation thesis, triggering immediate risk mitigation and pointing toward a deeper macro mean-reversion test.


Comments