
Copper Futures

This research note is free.
Please Note: When Published Intraday (JSE Equities), Prices Are Delayed By 15 Minutes.
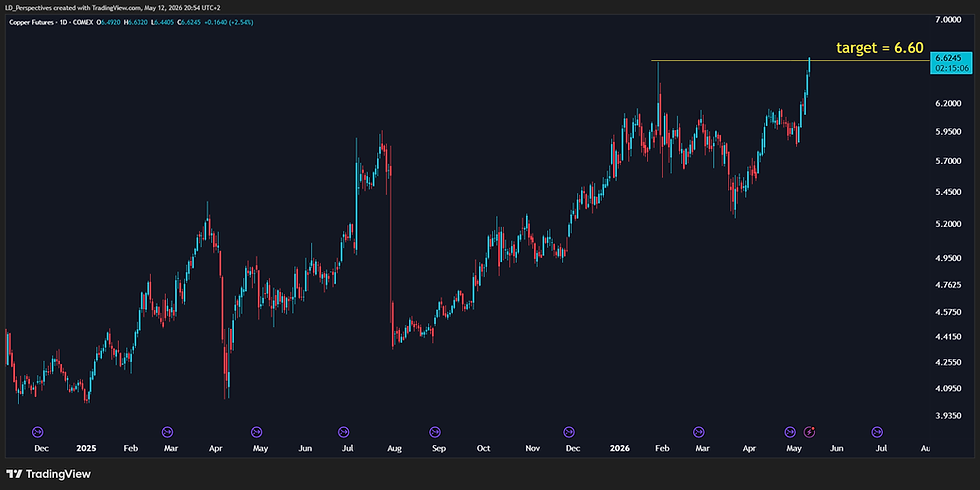
On 12 May, Copper reached our long term target at 6.60. This note is an update on the current reward-to-risk dynamics.
Disclosure: The commentary below was compiled using an artificial intelligence tool, based on my own inputs/data.
Analyst Verdict: 🟢 Buy on pullback
COMEX Copper is undergoing a tight, high-level volatility compression within a powerful, secular macro expansion. After printing a fresh all-time record peak at $6.8940/lb, the contract has absorbed brief profit-taking across a well-defined upper consolidation shelf bounded between $6.3500 and $6.8000. Price action on the daily chart highlights resilient dip-buying interest off the $6.4000 baseline, lifting the contract back toward $6.6915. Because the overarching secular momentum profile remains exceptionally strong while intermediate oscillators have worked off overbought extremes, this digestion phase offers an asymmetric risk-reward window to position for an impending breakout into the $7.0000+ expansion zone.
Reward-to-Risk (R:R) Dynamics | 🟢 Buy on pullback.
The Immediate LONG: Favorable R:R. Accumulating near current market levels (approx. $6.6915) allows for an explicit defensive invalidation stop mapped tightly below the $6.3500 – $6.4000 horizontal range floor, while targeting a primary retest of the $6.8940 peak and an unconstrained blue-sky extension toward $7.2000.
The Immediate SHORT: Extremely Poor R:R. Shorting a core global industrial commodity displaying persistent higher-low structures directly underneath all-time highs offers an exceptionally low mathematical expectancy.
What Can Go Right From Current Levels (Risk For Short Sellers)
For Existing Sell/Short Positions:
Range-Ceiling Breakout Acceleration: Bears defending the upper boundary between $6.7500 and $6.8000 face severe squeeze risk. A decisive daily push above recent swing highs will trigger an immediate wave of stop-loss buy stops, forcing rapid position abandonment into thin overhead liquidity.
Higher-Timeframe Trend Dominance: Traders carrying short exposure are battling an uncompromised monthly secular markup channel. The failure of sellers to drive price below the weekly 7-period baseline confirms that institutional demand continues to absorb supply at elevated levels, threatening to trap late-cycle counter-trend positions.
For Potential (New) Sell/Short Positions:
Selling into Compressed Momentum Coils: Initiating new short positions while the daily oscillator is coiling constructively above the 50 neutral mark leaves virtually zero downside cushion. The contraction in volatility indicates an imminent directional expansion, which historical alignment heavily favors breaking to the upside.
Absence of Overhead Structural Resistance: Because copper trades near absolute historical records, short sellers lack established historical pivot clusters to frame favorable stop placement, skewing the mathematical loss potential heavily against new capital.
What Can Go Wrong From Current Levels (Risk For Buys/Longs)
For Existing Buy/Long Positions:
Unrealized Gain Retracement: Allocators who entered during the earlier stages of the 2026 impulse risk sacrificing substantial open profits if the immediate $6.4000 support shelf fails. A sustained breach below this level would convert a shallow bull flag into a broader multi-week corrective retest of the psychological $6.0000 handle.
Range-Floor Liquidity Hunting: Trailing stops anchored too closely to the recent $6.3445 spike low could be swept during an aggressive intraday shakeout before institutional bids definitively take control.
For Potential (New) Buy/Long Positions:
Overhead Range-Resistance Rejection: Executing fresh market buys near $6.7000 exposes new capital to localized range-bound churn. If buyers fail to clear the $6.8000 – $6.8940 ceiling on the first attempt, newly opened positions could suffer immediate negative drift back toward the range median.
Patience & Capital Efficiency Drag: Entering ahead of a confirmed daily close above the record high carries the risk of enduring a prolonged, directionless sideways grind between $6.4000 and $6.7500, temporarily locking up deployable liquidity while the coil matures.
Support Zone Mapping
Immediate Tactical Support (The Consolidation Floor): $6.3500 – $6.4500. The multi-tested horizontal shelf where intraday flushes consistently encounter aggressive institutional absorption.
Secondary Support Shelf (The Major Change-of-Polarity Axis): $5.8500 – $6.0500. The definitive breakout platform from early Q2 2026 that serves as an ironclad intermediate defensive line.
Primary Macro Support (The Secular Baseline): $4.8500 – $5.2500. The multi-year launching pad established in late 2025 that underpins the entire structural cycle.
Tactical Probability Profile
Action Logic: Why two buy actions?
Buy on Pullback targets value execution within the current digestion corridor, taking full advantage of localized intraday dips toward the $6.5000 pivot.
Buy (Continuation) serves as the high-momentum trigger, deploying fresh capital once a definitive daily close above the $6.8000 mark confirms range resolution into blue-sky territory.
🟩 LONG: At Current Consolidation Ledge | 75% 🟢 (Buy on pullback)
🟦 LONG: On Daily Breakout Above $6.8000 | 70% 🟦 (Buy continuation)
🟩 LONG: At $6.4000 Range Base Retest | 85% 🔵 (Buy on deeper pullback)
🟨 SHORT: Tactical Fade Near $6.8800 | 25% 🟨
Technical Valuation & Variance Matrix
Estimated Technical Fair Value (TFV): $6.5200. Calculated as the volume-weighted equilibrium point of the ongoing three-month trading range.
Current Price Premium: The contract trades at a modest +2.63% premium relative to its TFV, indicating that price action is well-anchored within its broader consolidation structure rather than behaving in an overbought manner.
Tactical Upside Potential: +3.03% to the immediate record peak at $6.8940 (and +7.60% to the primary secular Fibonacci expansion target of $7.2000).
Tactical Downside Risk: -3.61% to the tactical support band floor ($6.4500) and -5.18% to the hard invalidation line below the swing low ($6.3445).
Asymmetry Ratio (R:R Metrics): At current market levels, a strategic trade targeting $7.2000 while risking against a confirmed daily closing breakdown below $6.4500 yields a solid 2.11:1 Upside-to-Downside ratio.
What Can Change
Range Invalidation Breakdown: A sustained daily close below $6.3400 would break the intermediate market structure, opening an air pocket for a deeper corrective descent toward the $6.0000 psychological shelf. 🟥
Impulsive Momentum Expansion: A high-volume daily close above $6.8000 will signal the official ignition of the next markup leg, accelerating price toward the $7.2000 projection level. 🟦
Prolonged Coil Compression: Failure to breach either boundary over the next two weeks will confine price to an extended lateral churn between $6.4500 and $6.7500. ⬜
Structural Breakdown
1-Day Structure (High-Level Basing): As demonstrated in file HG1!_2026-09-20_13-23-51.png, the contract is tracing out a classic bullish pennant/box pattern. Recent candles demonstrate a distinct curling up from the $6.4000 low, with green accumulation bars steadily reclaiming the upper half of the range.
Weekly Structure (Bull Flag Extension): As demonstrated in file HG1!_2026-09-20_13-23-45.png, the weekly chart reveals an impeccably ordered ascending trend staircase. The multi-week pause beneath $6.8000 has served to consolidate the vigorous markup originating from the $4.4000 macro base.
Monthly Structure (Secular Blue-Sky Breakout): As demonstrated in file HG1!_2026-09-20_13-23-37.png, the macro timeframe exhibits a historic breakout from a multi-decade cyclical formation, confirming that copper has entered an unconstrained secular price discovery phase.
Velocity & Slope Analysis
1-Day Slope (Curling Positive): Approx. +20 to +25 Degrees. The daily trend vector is rotating upward out of its localized base, signaling that immediate buying pressure is re-engaging.
10-Day & 20-Day Slope (Neutral Compression): Approx. 0 to +5 Degrees. Intermediate-term moving average vectors remain flat to slightly positive, confirming an equilibrium coil awaiting trend release.
Secular Slope (Monthly): Approx. +45 Degrees. The multi-year trajectory maintains an exceptionally steep and durable positive angle, providing an overwhelming macro tailwind.
Momentum Profile Integration
The Faster Tiers: Following the successful bounce off the lower channel, both the Ultra Short Term and Short Term momentum tiers have reset cleanly from previous overbought conditions and are actively expanding upward within constructive neutral-to-strong territory.
The Slower Tiers: The Structural Trend (Weekly) and Secular Cycle (Monthly) momentum profiles continue to register as Strong to High Bullish Momentum. Because higher-timeframe momentum engines remain firmly locked in an expansion regime without flashing macro divergence, the broader weight of the technical evidence heavily favors an upside breakout.
Previous Post (12 May): Copper Futures: Long Term Target Reached at $6.60
Previous Post (09 July 2025) (Link > https://www.unum.capital/post/hgtari )
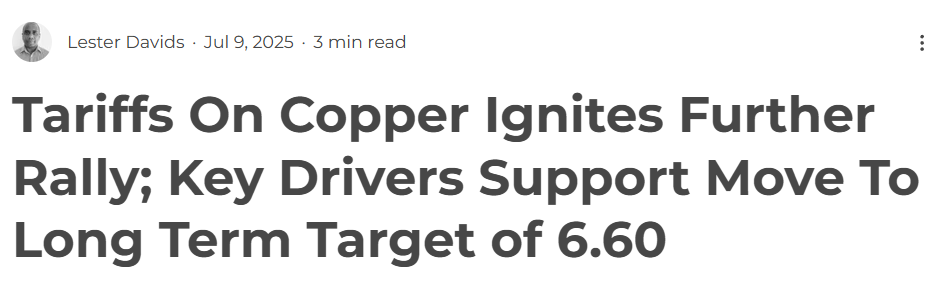
Tariffs On Copper Ignites Further Rally; Key Drivers Support Move To Long Term Target of 6.60

Previous Post (01 July): Copper Futures: Bull Flag Sees Upside Follow-Through; Trades At Multi-Month High of $5.18.
The bull flag discussed on 26 May has see strong upside follow-through. Traded above 5.00 earlier in this session.

Previous Post (21 May): Copper Futures: Bull Flag Emerging?
A break above 4.73 targets 5.15.

Previous Post (20 March): Copper: Repeating It's Mid 2000s Cycle?
We have a long history discussing Copper, since the lows during Covid at $2.31.
This is an update.
What we saw then... (the potential for a post 2001 to 2003 cycle run-up).

How it's developed thus far...

Previous Posts

Previous Post: Copper - Your Questions Answered (14 January 2025)

Here's a summary of the price action model for Copper Futures:
Q: What is the overall trend of Copper Futures? A: The overall trend is Bullish.
Q: What is the current 7-day trend? A: The current 7-day trend is Overbought.
Q: What is the current 14-day trend? A: The current 14-day trend is Very Bullish.
Q: Is there any opportunity for a short-term buy/long position? A: Yes, there is a potential opportunity for a short-term buy/long position. The model suggests looking for a pullback to the 8 or 21 EMA (Exponential Moving Average) as a potential entry point for the next move higher.
Q: What is the outlook for the medium term (2 to 4 weeks)? A: For the medium term, the advice is to expect a steady upward trend. It's recommended to apply daily/weekly moving averages where applicable.
Q: What is the outlook for the long term (5 to 8 weeks)? A: In the long term, the advice is to anticipate a continuation of the bullish regime. If Copper Futures pull back, the model suggests using the prior session close or the 8-EMA as an accumulation zone. It's recommended to apply weekly moving averages and time frames (not daily).
In summary: The price action model for Copper Futures indicates a bullish overall trend with a short-term overbought condition. Traders are advised to look for potential pullbacks to enter long positions. The medium-term outlook is for a steady upward trend, while the long-term expectation is for a continuation of the bullish regime.

Previous Post: This Is How I'm Looking At Copper + Updated Target
Thursday, 03 October 2024
Time Published: 19h26
Great comeback on the back of the Chinese stimulus announcement, with the continued development of a +3 year base.
Measured move target (medium/long term) = $6.60

Previous Post: Tuesday, 24 September at 11H16
The People's Bank of China (PBoC) introduced several measures to boost the economy amid concerns that the official growth target of around 5% might be out of reach due to recent weak data. Governor Pan Gongsheng said in a media briefing today that the central bank will cut the reserve requirement ratio (RRR) by 50bps, which will inject CNY 1 trillion into the financial system, with the possibility of another reduction of 0.25 to 0.5 ppts later this year. In addition, the PBoC will lower the seven-day reverse repo rate by 20bps to 1.5%, aiming to reduce short-term borrowing costs for banks. This move is accompanied by a 30bps reduction in borrowing costs of the medium-term lending facility. Mortgage rates will also be trimmed, with an expected average drop of 50bps, and the minimum down payment for second homes will be cut to 15% from 25%. Pan did not specify when the moves will take effect. Tuesday's action came after the US Fed started its monetary easing cycle with a large rate cut - Source: TradingEconomics

Previous Post (26 August 2024)
US Trading Session (Mon, 26-Aug-2024), Time: 19h00 (S/Africa)
Was $3.95 vs a multi-week high of $4.23 today.

Previous Post (07 August 2024)
Real-Time: 14h36
Trading at it's previous breakout level.


Previous Post:
UPDATE: Copper has retraced from it's short and medium term overbought levels, having traded above $5.00. This follows an impressive run, one that we discussed on 16 November 2023. The automated model gave us a reading on 15 May, warning of an unappealing reward-to-risk on the upside i.e. expect a pullback. At current levels, the commodity trades in a high bearish momentum regime, approaching short term oversold levels. In addition, it is trading at or around the rising 21-week exponential moving average (EMA), a level at which bulls could re-emerge. The short term trend remains down, however active traders would want to monitor for early signs of price stabilization which could signal the start of a base and potentially a bullish reversal.

Downside risk, as highlighted on 15 May:

Upside Opportunity on 16 November 2023:

I've been a copper bull since May 2020. This was the setup, as I highlighted and discussed at the time.

Lester Davids
Analyst: Unum Capital


Comments