Dis-Chem Pharmacies: Down 5.7% On Results + In Line With Model Reading
- Lester Davids

- May 30, 2025
- 2 min read
Research Notes For 02 to 06 June > https://www.unum.capital/post/r0206june
Trade Local & Global Financial Markets with Unum Capital.
To get started, email tradingdesk@unum.co.za
DCP has given us opportunities on both the buy and sell side. The model reading below is what was published in Thursday evening: "Strong upside move, but momentum slowing with sellers becoming active". The chart is as of Friday morning at 11h40.


Previous Post (Monday, 26 May): Dis-Chem Pharmacies: Into The Buy Range, Overshoot & Rally (+26%)
This is an update on the previous posts where we highlighted the ACTIONABLE AREAS. Scroll further down to view the original posts.
Do you recall the recent market volatility i.e. early April (Thursday 03, Friday 04 and Monday 07 April)? The share traded into the buy range, then overshot on the downside which was followed by a rally. Today, the share has continued to rally on the group's trading statement.

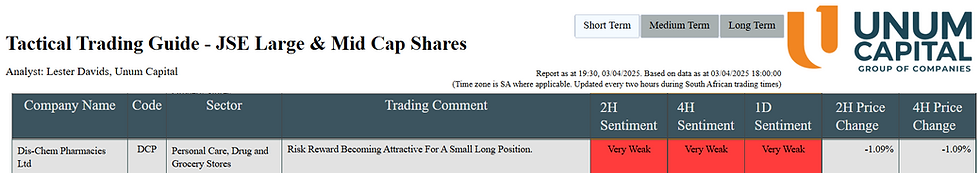
We also saw triggers in the lows (Thursday, 03 April) where the model highlighted that the share was becoming attractive for a small buy/long position.

Previous Post: Trading Dis-Chem Pharmacies: Actionable Areas
We discussed DCP on 07 January as part of a note where the 200-day SMA was a focus. A bearish divergence was highlighted and we have since seen the share decline from 3720 to Friday's low of 3233, a decline of 13%.
Running the price action model, there are some early triggers that suggest the share is becoming attractive for a small buy/long position. We combine this with a manual view of actionable areas which can be found further down this page.


DCP Actionable Areas


Previous Post (07 January): WORTH NOTING: 200-Day Developments (Tiger Brands, Outsurance, Mr. Price & More)

I used Artificial Intelligence to provide an explanation on why the 200-day SMA is significant. Here's what it had to say:
The 200-day Simple Moving Average (SMA) is a widely used technical indicator in trading. It calculates the average closing price of an asset over the past 200 trading days, providing a smoothed representation of price movements. This smoothing effect helps traders identify longer-term trends amidst daily price fluctuations.
Key Developments and Implications:
Support and Resistance: When the price of an asset is above the 200-day SMA, it often acts as a support level. Conversely, when the price is below the 200-day SMA, it can act as resistance.
Trend Confirmation: A sustained move above the 200-day SMA can signal a bullish trend, while a sustained move below it can indicate a bearish trend.
Crossovers: Crossovers between the price and the 200-day SMA can generate trading signals. For example, a price crossing above the 200-day SMA might be interpreted as a bullish signal, while a cross below could be seen as bearish.
Time Frame: The 200-day SMA is a long-term indicator, typically used to analyze trends over several months or even years.
In Summary:
The 200-day SMA is a valuable tool for traders and investors to:
Identify long-term trends
Determine support and resistance levels
Generate trading signals
Assess the overall market sentiment
By understanding the 200-day SMA and its implications, traders can make more informed decisions about their investment strategies.
Lester Davids
Analyst: Unum Capital


Comments