JSE Food Retailers: Momentum Profiles + Price Action Models + Core Thesis
- Lester Davids

- Jan 1
- 8 min read
Research Notes January 2026 > https://www.unum.capital/post/rjan2026
Trade Local & Global Financial Markets with Unum Capital.
To get started, email tradingdesk@unum.co.za
Technical Take: Shoprite Holdings (SHP)

Date: Thursday, January 1, 2026 Regime: Weak / Consolidating Primary Outlook: Sell on rally
Momentum Profile (Daily)
Ultra Short Term: Neutral
Short Term: Neutral
Mid Term: Neutral
Base Term: Neutral

Core Thesis
Shoprite remains in a state of suspended animation with a unanimous "Neutral" profile. Currently, the lower timeframes are not showing the aggressive early signals seen in peers like Pick n Pay or Spar. This lack of "ignition" on the Ultra Short or Short Term horizons reinforces the view that the stock is merely drifting rather than accumulating.
For a bullish case to develop, we would need to see the Ultra Short Term indicators fire into "Strong" or "High Bullish" territory first—acting as the early warning of a regime change. Until that distinct shift in character occurs on the lower timeframes, the probability remains weighted towards a continuation of the weak/consolidating structure.
Actionable Setup
The Signal to Watch: Watch the Ultra Short Term momentum closely. It needs to break out of "Neutral" to signal that an early move is underway.
The Trade: Without that lower-timeframe spark, the stock remains a "Sell on Rally" candidate. Buying here is premature as there is no leading energy to suggest a breakout is imminent.
Technical Take: Woolworths Holdings (WHL)

Date: Thursday, January 1, 2026 Regime: Bullish Reversal / Tactical Overbought Primary Outlook: At or approaching sell/reduce
Momentum Profile (Daily)
Ultra Short Term: High Bullish Momentum / Approaching Overbought
Short Term: High Bullish Momentum / Approaching Overbought
Mid Term: Strong
Base Term: Neutral

Core Thesis
Woolworths is exhibiting a powerful impulse. The "High Bullish Momentum" on the Ultra Short and Short Term frames should be viewed constructively here: rather than just signaling "overbought" exhaustion, these elevated readings confirm breakout velocity. This sustained intensity on lower timeframes is often the hallmark of a genuine trend reversal, where buyers remain aggressive even at higher prices.
While the "Approaching Overbought" status warrants tactical caution for immediate entries, it serves as an early confirmation that the structural trend is shifting. The fast moving averages are successfully "dragging" the Mid Term sentiment into "Strong" territory, validating the reversal hypothesis.
Actionable Setup
The Probability: The strength in the lower timeframes suggests that any pullback will be shallow and bought aggressively (a "Buy on Dip" environment is forming).
Tactical View: While we are "At or approaching sell/reduce" due to immediate extension, this is likely a pause in a new uptrend. Watch for the lower timeframes to cool from "High Bullish" to "Strong" without price collapsing—that would be the confirmation of a sustainable early move.
Technical Take: Spar Group (SPP)

Date: Thursday, January 1, 2026 Regime: Bearish / Attempting Rebound Primary Outlook: Sell on rally
Momentum Profile (Daily)
Ultra Short Term: High Bullish Momentum / Approaching Overbought
Short Term: Strong
Mid Term: Neutral
Base Term: Neutral
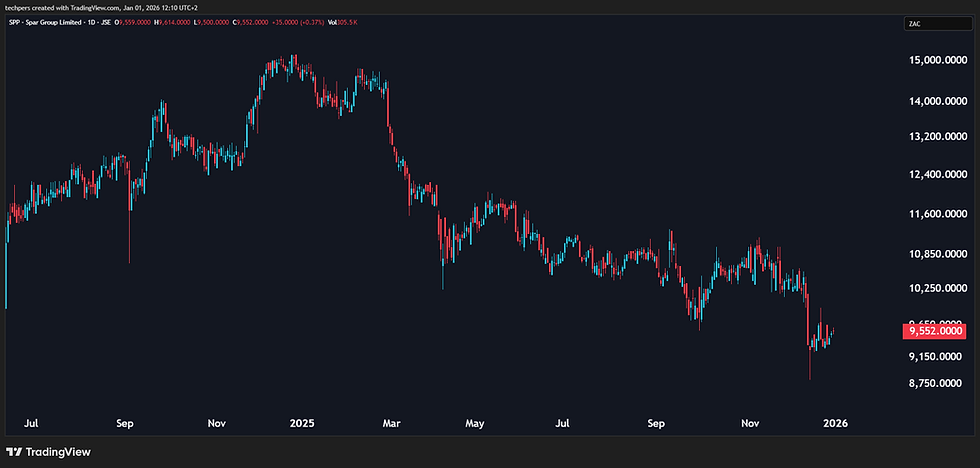
Core Thesis
Spar presents a classic "Early Move" divergence. The aggressive spike in Ultra Short Term momentum ("High Bullish") contrasts with the lethargic "Neutral" Mid/Base terms. While this can indicate exhaustion, it is also the distinct signature of a V-shaped recovery impulse.
The fact that the Short Term has already shifted to "Strong" suggests this is more than just noise; it is a concerted effort by buyers to reverse the trend. If this lower-timeframe strength can be sustained, it will act as the leading indicator that eventually pulls the Mid Term and Base Term indicators higher. We are likely witnessing the "Ignition Phase" of a potential bottom.
Actionable Setup
The Nuance: Do not blindly fade this rally. The intensity of the lower timeframes suggests the "Sell on Rally" outlook might be challenged soon.
The Trigger: If price consolidates here but the Ultra Short Term momentum stays "Strong" (refusing to drop back to "Weak"), it confirms this is a structural change and not a trap.
Technical Take: Pick n Pay (PIK)

Date: Thursday, January 1, 2026 Regime: Bearish / Early Bottoming Signs Primary Outlook: Sell on rally
Momentum Profile (Daily)
Ultra Short Term: High Bullish Momentum / Approaching Overbought
Short Term: High Bullish Momentum / Approaching Overbought
Mid Term: Neutral
Base Term: Neutral

Core Thesis
Pick n Pay is showing the most aggressive "Early Move" signal of the group. The synchronized surge to "High Bullish Momentum" on both Ultra Short and Short Term horizons represents a violent wake-up call for a stock that has been trending down.
This behavior is typical of a Short Squeeze or an Accumulation Spike, where smart money enters aggressively. While the Mid Term is still "Neutral," these lower timeframe readings are leading indicators that the character of the market has changed. This is likely the necessary "escape velocity" required to break the bearish inertia. Rather than pure exhaustion, this looks like the start of a momentum shift.
Actionable Setup
The Strategy: Treat this as a potential "Change of Character." The probability of a successful bottom has increased significantly due to the sheer force of the lower timeframe move.
The Risk: The gap between "High Bullish" (Short Term) and "Neutral" (Mid Term) is wide. Watch for a "Bull Flag" consolidation: if PIK can digest this move sideways while keeping momentum elevated, the bottom is in.
Trading Notes/Resources (Where Applicable)
READY TO TRADE: ACTIONABLE AREAS: For active traders who look to generate cash flow on a continuous basis, determining the ‘next best probability’ level to execute against may be of immense value. The blue and red horizontal lines on the chart represent a next best probability buy re-entry range and a next best probability sell re-entry range over the short term. The ranges assume no existing position being held by a trader while the probabilities are based on several factors which may include: short term rating, medium term regime, momentum, horizontal or diagonal support/resistance, candle structure, moving averages and standard deviation, among others. These are short term levels and may be in contrast to medium and long term outlooks which are based on the weekly and monthly charts and, which may be applicable to long term investors. These levels are subject to change based on sentiment, the subsequent price action and company/sector specific or macro news flow. As always, while the levels are outlined, traders should be prepared to adjust in real-time based on the aforementioned.
"Strategy Alerts" help clients identify trading opportunities. When a ticker's real-time or pre-market price action aligns with the criteria on a slide—such as a pullback to the 21-day EMA or a breakout from a consolidation base—it effectively "matches" that stock to the strategy, triggering an alert to a potential trading opportunity. This approach transforms the playbook into a dynamic scanning tool, allowing you to instantly categorize active stocks by the specific technical thesis playing out, ensuring that every trading potential opportunity communicated is backed by a predefined, actionable setup.
THE TACTICAL TRADING GUIDE (PRICE ACTION MODEL): UNCOVER OPPORTUNITIES & ASSESS REWARD-TO-RISK
It helps helps clients determine and shed light on the some of the following:
The CURRENT TECHNICAL POSITION and a PRICE ACTION PROBABILITY for multiple time frames.
Three (3) ‘trading’ time frames are considered: Short Term (1 to 10 days) / Medium Term (2 to 4 weeks) and Long Term (5 to 8 weeks)
Whether the reward-to-risk is attractive for a buy/long position
Whether a share is weak. In this case, wait until the price stabilizes before looking to enter (i.e. want until it stops going down)
Whether aggressive buying is underway. In this case, do not ‘chase’ (do not buy) but instead wait for a pullback to re-enter a buy or an overextension with deteriorating candle structure to sell/short.
Whether a trader can look to buy a pullback into a key moving average (continuation trade)
Whether a share needs to break a range for a new trend to be determined (bullish or bearish)
Whether a traders needs to monitor for a change of character that could lead to a bullish or bearish reversal
Whether a share could start a consolidation phase or before continuing it’s bullish or bearish trend
Whether the upward momentum is slowing (if it's in a bullish phase)
Whether buyers can look to 'phase in' to a position (if it's in a bearish phase)
Whether a share lacks directional bias.
The data set is available in real-time (on request)
The readings are subject to change as the price action develops.
TRADING TIP # 1 Let The Candle Confirm
Out of all those available, Candlestick Charts are the most widely used when it comes to analyzing price from a technical perspective. The interpretation thereof helps traders to understand the interaction between market participants and informs who is in control between buyers and sellers. Various types of candle formation convey key information about the range of outcomes for a share for example, following a downward trend, a long lower tail, doji, piercing or bullish engulfing suggests that buyers have started to become active/started to take an interest while following an upward trend, a long upper tail, doji, dark cloud cover or bearish engulfing suggests that sellers have started to become active/started to take an interest. While information is conveyed pre-market, it is the intraday price action that will confirm any trade or opportunity. While we have a plan, we are also ready to switch gears as the price action develops.
TRADING TIP # 2: Failure & Reclaim
FAILURE to hold a prior session high/range high may signal that the upside momentum is slowing and that an opportunity to short/sell may be at hand. This is often reflected via a deteriorating candle structure which suggests that sellers are starting to take control. Examples of such candles are long upper tails, doji's, dark cloud covers, bearish engulfing candles etc. RECLAIMING a prior session low/range may signal that the downside momentum is slowing and that an opportunity to buy may be at hand. This is often reflected via a improving candle structure which suggests that buyers have started to enter and are looking to take control of the price action. Examples of such candles are long lower tails, doji's, piercing candles, bullish engulfing candles etc.
TRADING TIP # 3: Take Note of the 'Igniting Bar'
This is a large green or red candle which suggests that traders should: TAKE NOTE note of the change in characters and potential change of the trend. TAKE NOTE of a potential acceleration of the trend. TAKE NOTE of potentially aggressive buy or selling Often, BIG MOVES start with BIG MOVES.
Core Trading Principles: Short and Medium Term
Trade with the primary trend.
Volume Matters. This represents the interest of large institutional investors who have the ability to move a share, both up and down.
Do not short/sell a share that is above, and in close proximity to it’s rising 8 and 21-day moving averages. This trend can persist for an extended period.
Ultra short term traders, if a share has advanced strongly over a 3-7 day period, book profits. You can always re-enter and do the same trade at lower levels.
If a share is printing a large bullish (green) candlestick following an extended move, use the strength to sell. The likelihood that the share retraces is high.
If a share is printing a large bearish (red) candlestick following an extended move to the downside, use the weakness to start a long position. The likelihood that the share rebounds is high.
Trade in the direction of the 20-day moving average, using the MA as a level to enter as well as a hard break thereof as a trailing stop-loss.
The 8 and 21-day moving averages often act as support and resistance levels. When they are turning down, use them as levels to sell into. The opposite applies when they are turning up.
The first back-test and undercut of the 50/75-day exponential moving average range has a high probability of holding as support or resistance. Buy or sell it for a 1-3 day move to generate cash flow.
Stocks above a rising 200-day moving average spend the majority of their time trending higher. The opposite applies when the 200-day is trending down.
Previous support can turn into resistance and previous resistance can turn to support. Use these zones as levels to trade against.
Support and resistance levels and key moving averages are ranges rather than exact levels. They often overshoot these zones before occasionally reversing at these levels.
Respect the FIB (Fibonacco) retracement zones. They often act as support and resistance levels.
‘PAY-tience Pays’, however be nimble to react to opportunity to cut when a trade hasn’t been working.
Above all, know your time horizon.
Lester Davids
Senior Investment Analyst: Unum Capital


Comments