
⬜Neutral 🟦Buy On Deeper Pullback

Research Notes May 2026 > https://www.unum.capital/post/rmay2026
Trade Local & Global Financial Markets with Unum Capital.
To get started, email tradingdesk@unum.co.za

FIRSTRAND LTD (FSR) The Mid Term and Base Term momentum readings for FirstRand reflect a predominantly Neutral ⬜ regime, establishing a definitively rangebound structural foundation. However, the overall technical picture across forward-looking timeframes indicates a constructive shift in the underlying price action. In the short term, FSR is attempting a bullish reversal out of a consolidation phase, generating a cautious Neutral-Bullish 🟨 stance. Medium-term technicals target a rebound within the established range, favoring long entries on strong bids near range highs. Long-term structural accumulation remains Bullish 🟩, utilizing a definitive Buy on deeper pullback 🔵 execution strategy that explicitly targets the 21-EMA as a high-probability buy range if immediate 8-EMA support is breached.
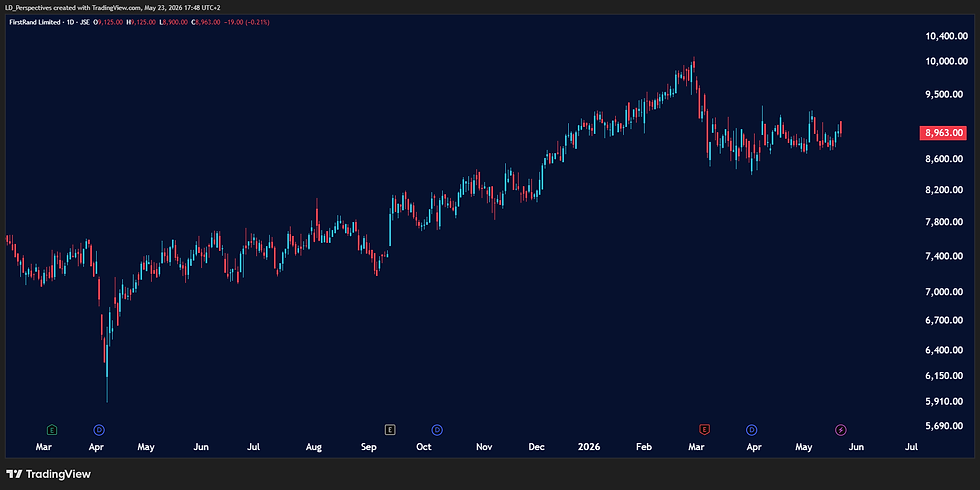
Sector: Financials / Banking
Closing Price: 8,963 ZAC
1W Change: +2.13%
Action Bias: ⬜ Neutral (Rationale: Both the Daily and Weekly Mid Term momentums have settled into the Neutral regime, establishing a tight consolidation phase. Although the overarching Monthly Mid Term momentum retains a Strong posture, the current lack of short-term velocity warrants a patient, neutral tactical approach until a new directional impulse emerges from this equilibrium.)
Multi-Frame Action: ⬜ Neutral (D) ⬜ Neutral (W) 🟩 Strong (M)
Technical Upside: Resistance at 10,000 ZAC (Psychological / Recent Swing High).
Target: 9,500 – 10,000 ZAC (Structural Extension).
Momentum Signal: Daily and Weekly Mid Term momentums are Neutral, digesting the gains within a Strong macro Monthly trend.
Risk / Invalidation: Close below 8,200 ZAC (Structural Support Base).
Valuation Basket: SA Inc. / Financial Sector Proxy.
Primary Driver: Local interest rate environment, macroeconomic stability, and domestic credit growth.
Market Structure & Volume
Volume Profile: Consolidation patterns are forming as the market digests recent markups, with price action respecting structural support parameters.
Liquidity Zones: Tactical support is well-established in the 8,200 – 8,400 ZAC block. Sustaining levels above this zone keeps the broader bullish structure intact.
Divergences: None. The alignment of Mid Term momentum across the lower timeframes indicates a natural pause rather than structural exhaustion.
Relative Strength vs. JSE Top 40: Outperformer. FSR continues to act as a resilient anchor within the South African banking cohort.
Relative Strength vs. Financials: Market Leader. Exhibiting sustained structural stability relative to peer domestic institutions.
READY TO TRADE: ACTIONABLE AREAS
For active traders who look to generate cash flow on a continuous basis, determining the ‘next best probability’ level to execute against may be of immense value, specifically by helping to determine the best potential times and levels to commit capital.
The blue and red horizontal lines on the chart represent a next-best-probability buy re-entry range and a next-best-probability sell re-entry range over the short term. The ranges assume no existing position is being held by a trader, while the probabilities are based on several factors, which may include:
Short-term ratings and medium-term regimes
Momentum indicators
Horizontal or diagonal support and resistance
Candle structure
Moving averages and standard deviation
Please note that these are short-term levels and may contrast with medium- and long-term outlooks, which are based on the weekly and monthly charts and are generally more applicable to long-term investors. These levels are subject to change based on market sentiment, subsequent price action, and company/sector-specific or macroeconomic news flow. As always, while the levels are outlined to guide your capital deployment, traders should be prepared to adjust in real-time based on the aforementioned factors.
THE TACTICAL TRADING GUIDE (PRICE ACTION MODEL): UNCOVER OPPORTUNITIES & ASSESS REWARD-TO-RISK
It helps helps clients determine and shed light on the some of the following:
The CURRENT TECHNICAL POSITION and a PRICE ACTION PROBABILITY for multiple time frames.
Three (3) ‘trading’ time frames are considered: Short Term (1 to 10 days) / Medium Term (2 to 4 weeks) and Long Term (5 to 8 weeks)
Whether the reward-to-risk is attractive for a buy/long position
Whether a share is weak. In this case, wait until the price stabilizes before looking to enter (i.e. want until it stops going down)
Whether aggressive buying is underway. In this case, do not ‘chase’ (do not buy) but instead wait for a pullback to re-enter a buy or an overextension with deteriorating candle structure to sell/short.
Whether a trader can look to buy a pullback into a key moving average (continuation trade)
Whether a share needs to break a range for a new trend to be determined (bullish or bearish)
Whether a traders needs to monitor for a change of character that could lead to a bullish or bearish reversal
Whether a share could start a consolidation phase or before continuing it’s bullish or bearish trend
Whether the upward momentum is slowing (if it's in a bullish phase)
Whether buyers can look to 'phase in' to a position (if it's in a bearish phase)
Whether a share lacks directional bias.
The data set is available in real-time (on request)
The readings are subject to change as the price action develops.
Lester Davids
Senior Investment Analyst: Unum Capital


Comments