Multi-Time Frame Heatmap
- Lester Davids

- Jun 7
- 3 min read
Premium Content > https://www.unum.capital/post/premiumcontent
Free Content: June 2026 > https://www.unum.capital/post/rjune2026
Trade Local & Global Financial Markets with Unum Capital.
To get started, email tradingdesk@unum.co.za
Free Content
Note: When published intraday, JSE equity prices are delayed by 15-minutes.

1-Month Trend The 1-Month Trend heatmap reveals acute tactical weakness clustered heavily within the precious metals and domestic retail sectors. Deep red nodes dominate the visual field, driven by precipitous short-term collapses in names like Pan African Resources (PAN, -24.72%), Sappi (SAP, -23.17%), and Impala Platinum (IMP, -20.05%). Conversely, the few bright green patches are concentrated entirely in high-momentum technology and speculative plays, with ASP Isotopes (ISO) and Altron (AEL) surging over 25%, highlighting a market where capital is fleeing traditional cyclicals for isolated growth narratives.

3-Month Trend Extending the horizon to the 3-Month Trend, the heatmap illustrates a deeply entrenched bifurcation that has only worsened over the quarter. The commodity complex is split: while gold and platinum names continue to bleed into capitulatory territory (with PAN and SSW shedding over 30%), energy and chemicals—led by Sasol's (SOL) explosive +56.20% advance—shine bright green. This visual divide confirms that the recent market action is not a broad-based selloff, but a violent factor rotation where winners are aggressively accumulated and losers are structurally abandoned.

6-Month Structural The 6-Month Structural heatmap provides a stark visualization of long-term regime shifts, particularly the systemic destruction of the domestic consumer theme. The darkest red blocks belong exclusively to retail and packaging names—Spar Group (SPP, -50.35%), Sappi (SAP, -49.59%), and Clicks (CLS, -31.75%)—indicating a complete withdrawal of institutional support. On the bullish side, the map shows healthy, broad-based green distribution across diversified miners (GLN, S32) and tech/telecoms (MTN), proving that offshore-earning proxies have served as the primary defensive anchor for the index this year.

Intraday Order Flow (Gap Proxy) Looking at the Intraday Order Flow heatmap, which proxies opening gaps versus closing drift, the tape highlights extreme intraday volatility tightly correlated with momentum extremes. The brightest green nodes align precisely with the month's biggest winners (ISO, AEL, BYI), indicating that buyers are not only accumulating these names but are doing so violently at the open, creating runaway breakaway gaps. Meanwhile, the dark red clusters in the resource space suggest that sellers are dumping shares into the opening auction, with assets failing to catch any meaningful intraday mean-reversion bids.

Micro Tension (vs 8 EMA Proxy) The Micro Tension heatmap measures severe short-term stretching against the fast 8-period moving average, and currently, it displays a remarkably clean tape with only highly isolated extremes. Because most names have reverted to their fast averages, the map is largely neutral, save for the glaring outliers: ISO and AEL are stretched dangerously high above trend, warning of imminent tactical froth, while PAN and SAP remain pinned to the floor, reflecting an intense lack of short-term buying interest to relieve the oversold tension.
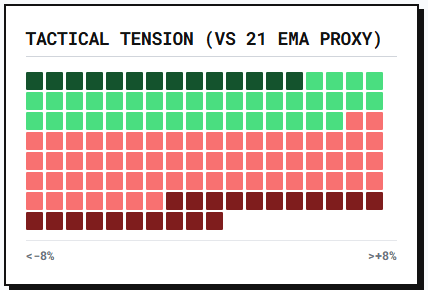
Tactical Tension (vs 21 EMA Proxy) The Tactical Tension heatmap visually mirrors the 1-month return profile, but contextualized as distance from the 21-day intermediate baseline, it reveals a tape heavily skewed toward downside momentum. A significant portion of the universe is printed in varying shades of red, signaling that the median stock is currently trading well below its active tactical trendline. This broad-based tactical weakness confirms that beneath the surface-level resilience of a few mega-caps, the average constituent is struggling to maintain upward structural momentum.
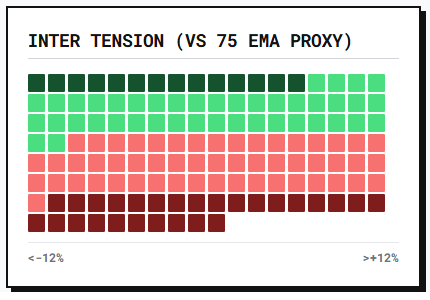
Inter Tension (vs 75 EMA Proxy) On the Inter Tension heatmap, the distance to the 75-period proxy shows the "fat middle" of the market is currently experiencing a profound directional struggle. While the extreme tails (tech on the high side, retail on the low side) are clearly defined, a massive cluster of grey and pale blocks indicates that financials (ABG, SBK) and large consumer defensive names are churning sideways. This suggests that allocators are waiting for a definitive macroeconomic catalyst before committing fresh capital to the market's core ballast.

Secular Tension (vs 200 SMA Proxy) Finally, the Secular Tension heatmap, measuring proximity to the 200-day moving average, paints a picture of a market clinging to long-term health by a thread. While the absolute number of stocks above their 200-SMA remains viable, the depth of the laggards is alarming; the retail cohort is painted in maximum red, trading more than 15% to 20% below their secular baselines. This visual confirms that while the index hasn't broken down completely, the structural damage in the weakest sectors is severe enough to require quarters, not weeks, of base-building to repair.
Lester Davids
Senior Investment Analyst: Unum Capital


Comments