
JSE Top 40 Index

September 2026 > https://www.unum.capital/post/rsep2026
NOTE: When Published Intraday (JSE Equities), Prices Are Delayed By 15 Minutes
The price chart, including the next best probability buy and sell ranges now form part of our PREMIUM content.

Execute Your Trades Via The Unum Capital Trading Desk:
Our research is often consumed by traders that execute our ideas via the trading desk of a competing service provider. This means that our screen time and research efforts are in vain as brokerage fees flow to our competitors. For this reason, some of our discretionary research insights are regarded as premium and available only to active trading clients. If you have been reading our research but use another trading services provider/broker to execute the trades, why not consider moving you trading account to Unum Capital thereby routing the trades through our desk?
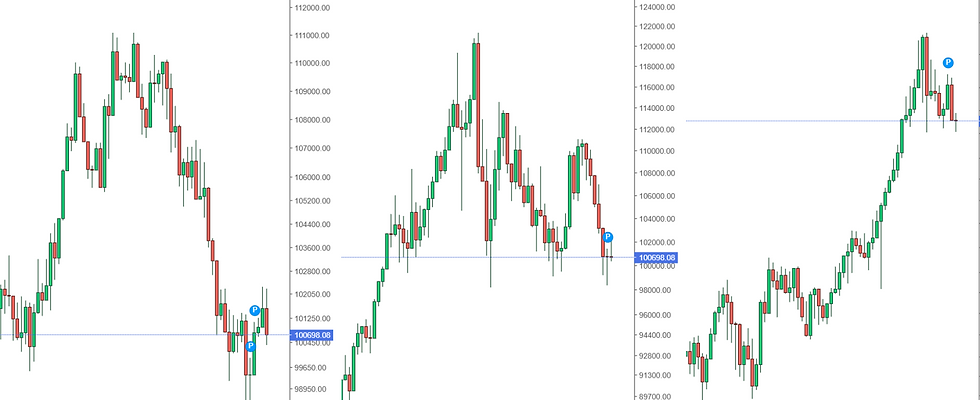
The index rebound from our buy re-entry range and is now is a consolidation phase.
STRUCTURAL RATING: ⭐⭐⭐☆☆
The reward-to-risk profile is constructive but requires tactical patience due to lower time frame weakness within a broader upward regime. For a Buy/Long position, the reward-to-risk is Moderate 🟨 because while the asset is in a steady macro upward trend, the short-term trend is neutral, the intermediate trend is rangebound, and the index is actively consolidating. Capital must wait for a validated test of dynamic support (the 21-EMA or 50-EMA) to trigger a rebound buy. Conversely, for a Short/Sell position, the reward-to-risk is Moderate 🟨; the long-term model specifically warns that a failure to hold prior session range highs creates a tactical short-sell opportunity against the consolidating tape.
TACTICAL ACTION SCALE
🟥 At/approaching sell/reduce
🟧 Sell (continuation)
🟨 Sell on rally
🟠 Sell on sharp rally
⬜ Neutral
🔵 Buy on deeper pullback
🟢 Buy on pullback — Pending: Waiting for a standard counter-trend dip to execute a buy. ⬅️ J200 IS POSITIONED HERE
🟦 Buy (continuation)
🟩 At/approaching buy/add
RATIONALE:
With short-term momentum reading as "Neutral" and intermediate momentum characterized as "Rangebound," the index is experiencing lower time frame weakness. However, because the medium and long-term structures confirm it is "Consolidating Within an Upward Trend," the primary tactical directive is to locate support. Market participants are instructed to monitor the 21-EMA or the 50-EMA for a successful reclaim to trigger a rebound buy, placing the index firmly in a Buy on pullback posture.
SCENARIO MATRIX (BASE, BEAR & BULL CASE)
Base Case (60% Probability):
Orderly Consolidation & Support Test: The lower time frame weakness persists, driving the index into a controlled pullback. Price action successfully tests support at the 21-EMA or just below the 50-EMA. Buyers defend these levels, triggering a validated reclaim that ends the short-term neutral and rangebound chop, allowing the broader upward trend to resume.
Bear Case (25% Probability):
Support Fracture & Deeper Correction: The anticipated consolidation breaks down as selling pressure intensifies. The index fails to hold both the 21-EMA and 50-EMA support zones. The short-term weakness overrides the macro upward trend, triggering a deeper structural correction and invalidating the rebound buy setup.
Bull Case (15% Probability):
Immediate Range High Breakout: Institutional bids overwhelm the lower time frame weakness, completely bypassing the need for a deep pullback to the EMAs. The index forcefully clears prior session range highs, neutralizing the long-term tactical short-sell warning and initiating an immediate upward continuation squeeze.
What Can Go Right From Current Levels (Risk For Short Sellers)
For Existing Sell/Short Positions:
Macro Trend Resurgence: Existing shorts are fighting an asset "Consolidating Within an Upward Trend." If the index successfully finds support at the EMAs and triggers a rebound buy, short positions will face aggressive upside pressure as the dominant macro structure reasserts control.
For Potential (New) Sell/Short Positions:
Shorting into Support: Initiating new short exposure while the index is actively hunting for support at the 21-EMA or 50-EMA is tactically flawed. Fading the exact zones where the model anticipates a "Rebound Buy" trigger exposes capital to an immediate technical squeeze.
What Can Go Wrong From Current Levels (Risk For Buys/Longs)
For Existing Buy/Long Positions:
Consolidation Drawdown: Investors holding long positions face immediate localized chop and negative drift. Because the intermediate trend is "Rangebound" and the short-term exhibits "weakness," existing longs must endure an uncomfortable drawdown as the asset rotates downward to test dynamic support.
For Potential (New) Buy/Long Positions:
Front-Running the Reclaim: Entering fresh long allocations prematurely without waiting for the required technical confirmation violates the model's instructions. If buyers step in simply because the asset is dipping, but fail to wait for the "Reclaim To Trigger Rebound Buy," they risk catching a falling knife if the support levels unexpectedly fracture.
Lester Davids
Senior Investment Analyst: Unum Capital


Comments