
JSE Top 40 Index

+30 Take Profit Opportunities: Our Capabilities > https://www.unum.capital/post/capabilities
Free Content: July 2026 > https://www.unum.capital/post/rjuly2026
Trade Local & Global Financial Markets with Unum Capital.
To get started, email tradingdesk@unum.co.za
NOTE: When Published Intraday (JSE Equities), Prices Are Delayed By 15 Minutes
Published on Friday 10 July at 15h45.
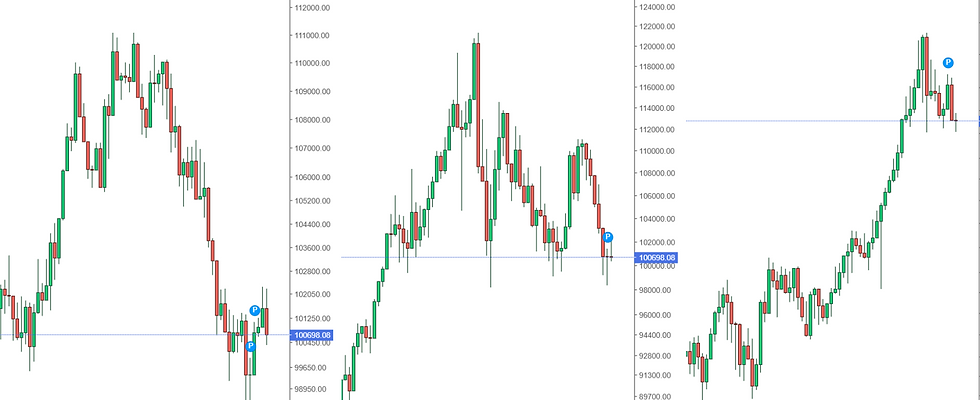
The structural profile for the FTSE/JSE Top 40 Index illustrates a mature primary uptrend experiencing severe intermediate-term deterioration. The index is currently locked in a structural correction, trading at 101,652 and remaining pinned beneath its key daily and weekly trend filters.

1. Multi-Timeframe Trend & Structural Damage
Daily Timeframe (Tactical Squeeze to Bearish Expansion): The index has sustained notable tactical damage, trading decisively below its 75-day EMA (105,680) and its 200-day SMA (107,065). The flattening and eventual rollover of the daily moving average ribbons indicate that the strong bullish regime of 2025 has yielded to a distribution and markdown phase.
Weekly Timeframe (Macro Breakdown): The macro structure is facing an important structural test. The price has breached its 21-week EMA (105,769) and is currently trading below its 50-week EMA (102,780). Remaining below the 50-week EMA formally shifts the higher-timeframe regime from a routine bull-market pullback to an intermediate-term structural correction.
2. Candle Trend, Quality, and Structure
Short-Term Candle Trend (Recent Days): The immediate trend is heavy and bound by a clear descending trendline from the macro peak. The index is currently consolidating at the lower bounds of its recent trading range, struggling to mount any meaningful counter-trend momentum.
Candle Quality: Low-quality corrective behavior. While recent daily candles show localized lower-wick rejections around the 98k–101k zone—signaling pocketed demand—the subsequent green candles are small, overlapping, and lack institutional velocity. The inability to cleanly reclaim the daily 8-day EMA (101,775) highlights a persistent lack of buying conviction.
Structure: The index is carving out a descending triangle/channel structure just above major horizontal support. The consecutive lower highs since early 2026 demonstrate consistent overhead distribution, trapping short-term buyers on every shallow bounce.
3. Confluence Support and Critical Zones
The chart outlines the primary technical thresholds defining the index's current geometry:
Daily 200-Day SMA (107,065): This serves as the primary long-term bull/bear line in the sand, now acting as major overhead structural resistance.
Weekly 21-Week EMA (105,769): A critical high-timeframe inflection zone that has flipped into a macro resistance ceiling.
Weekly 50-Week EMA (102,780): The immediate intermediate-term barrier that bulls must reclaim to neutralize the ongoing markdown phase.
Daily 8-Day EMA (101,775): The immediate dynamic tactical resistance pinning down daily price action.
Immediate Range/Swing Low Floor (~98,000–99,000): The historical horizontal support zone currently acting as the primary defense line to prevent a deeper macro flush.
Weekly 200-Week SMA (80,866): The ultimate long-term structural value line, resting deep below the current cyclical correction.
4. Risks
Risks for New Buy / Long Positions: Initiating new long positions at these levels carries substantial catching-a-falling-knife risk. While the index is trading near a local horizontal floor, it remains trapped underneath a descending trendline and major daily ribbons. Buying here risks exposure to a structural breakdown if the immediate support zone fails, which would trigger automated stop-out programs and accelerate a move into the lower air pocket.
Risks for New Short / Sell Positions: Shorting at current levels faces localized asymmetric risk due to proximity to the horizontal range floor. Because the index has been expanding downward for months and is currently testing structural support, trailing shorts risk getting caught in sharp, violent short-covering bounces or a tactical "bear trap" if institutional buyers defend this macro zone.
Conclusion: The JSE Top 40 is operating in a High Bearish Momentum tier across both daily and weekly frames. Until the index can decisively break above the descending trendline and reclaim the 102,780–105,769 cluster, the structural path of least resistance remains skewed to the downside.
Lester Davids
Senior Investment Analyst: Unum Capital


Comments