
JSE Top 40 Index

+40 Take Profit Opportunities: Our Capabilities > https://www.unum.capital/post/capabilities
Free Content: July 2026 > https://www.unum.capital/post/raug2026
Trade Local & Global Financial Markets with Unum Capital.
To get started, email tradingdesk@unum.co.za
NOTE: When Published Intraday (JSE Equities), Prices Are Delayed By 15 Minutes
Update: Friday's price action model on the JS Top 40 Index is unfolding with the price seeing a two-day bearish reversal from short term overbought levels. That being said, the index remains above it's rising 8-day exponential moving average which may act as a level of interest for ultra short term traders. A break of this EMA is likely to push the share toward the support zone which is made up of the intersection of the 21-day and 75-day EMA.

Previous Post (Friday 07 August): JSE Top 40 Index: The Reward-To-Risk From Current Levels

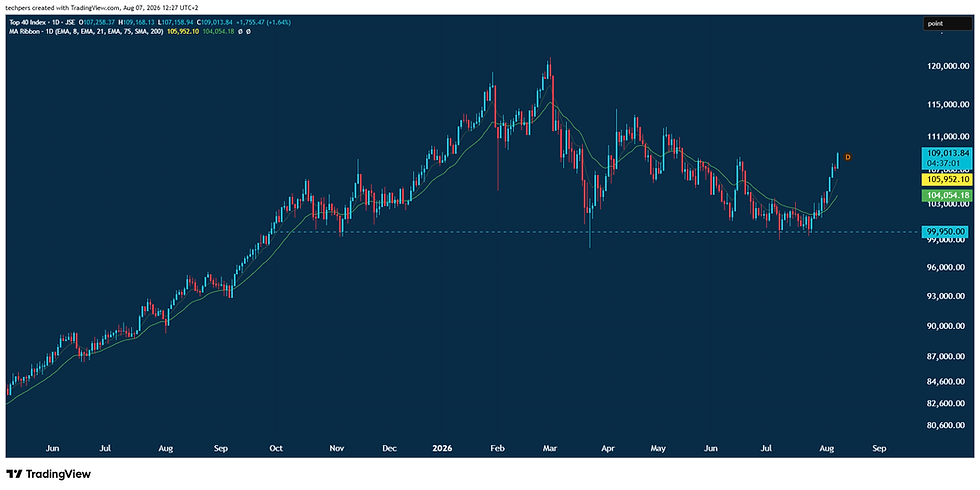
STRUCTURAL RATING: ⭐⭐☆☆☆
The reward-to-risk profile is currently constrained near-term by overextended momentum. For a Buy/Long position, the reward-to-risk is Poor 🟥 because the index has pushed into overbought territory on lower time frames, rendering fresh long entries at current levels highly unattractive. Conversely, for a Short/Sell position, the reward-to-risk is Moderate 🟨; while the long-term regime has resumed a powerful bull move in a strong upward trend, localized overextension offers a tactical window to look for a failure to hold prior session lows to initiate a brief 1-2 day short setup.
TACTICAL ACTION SCALE
🟥 At/approaching sell/reduce
🟧 Sell (continuation)
🟨 Sell on rally
🟠 Sell on sharp rally
⬜ Neutral
🔵 Buy on deeper pullback
🟢 Buy on pullback — Pending: Waiting for a standard counter-trend dip to execute a buy. ⬅️ J200 IS POSITIONED HERE
🟦 Buy (continuation)
🟩 At/approaching buy/add
RATIONALE: While J200 is currently "Overbought" near-term and short-term long entries carry an "Unattractive" risk-reward profile, its 14-day trend is "Very Bullish" and its long-term baseline "Has Resumed A Bull Move In A Strong Upward Trend." Because entering fresh long allocations at current elevated levels is structurally dangerous, the primary bias is to wait for a counter-trend consolidation or pullback to digest recent gains before safely adding long exposure.
SCENARIO MATRIX (BASE, BEAR & BULL CASE)
Base Case (60% Probability):
Overbought Digestion & Minor Pullback: The near-term tape remains highly extended, forcing a natural pause in upward velocity. The index fails to hold prior sessions, triggering the 1-2 day short setup, which allows the asset to safely bleed off overbought momentum and pull back into short-term moving averages before resuming its primary long-term bull move.
Bear Case (25% Probability):
Aggressive Technical Rejection: The anticipated failure to hold prior sessions attracts severe institutional distribution rather than standard profit-taking. A rapid unwinding of the "Very Bullish" 14-day trend forces the index into a deeper, highly volatile correction, pushing price well past standard pullback zones and threatening the underlying macro bull structure.
Bull Case (15% Probability):
Runaway Momentum Expansion: The index completely ignores its short-term "Overbought" condition. Relentless buying pressure forces an immediate continuation of the strong upward trend, denying short sellers their 1-2 day tactical setup and forcing sidelined capital to chase the rally at increasingly unattractive risk-reward metrics.
What Can Go Right From Current Levels (Risk For Short Sellers)
For Existing Sell/Short Positions:
Macro Trend Steamroller: Existing shorts are fighting a tape that is officially marked by a "General Trend Up" in the medium-term and a "Strong Upward Trend" long-term. If the index refuses to pull back and simply grinds higher through overbought conditions, short positions will face immediate capital erosion and an unchecked momentum squeeze.
For Potential (New) Sell/Short Positions:
Front-Running the Rejection: Initiating a fresh 1-2 day short setup before the index explicitly shows a "Failure To Hold Prior Sessions" carries high tactical risk. Stepping in front of a "Very Bullish" 14-day trend without a confirmed localized breakdown exposes new capital to rapid upside variance.
What Can Go Wrong From Current Levels (Risk For Buys/Longs)
For Existing Buy/Long Positions:
Immediate Mean Reversion: Investors holding long positions are actively riding an "Overbought" 7-day trend. As the asset naturally looks to establish a localized failure to trigger a 1-2 day short cycle, existing longs face an immediate, uncomfortable drawdown while price digests its recent vertical ascent.
For Potential (New) Buy/Long Positions:
Chasing the Apex: Entering fresh allocations at current levels explicitly defies the model's warning that the risk-reward is definitively "Unattractive." Buying here forces capital to absorb the brunt of the imminent pullback, guaranteeing compromised entry pricing and negative drift as the index seeks a structural floor.
READY TO TRADE: ACTIONABLE AREAS
For active traders who look to generate cash flow on a continuous basis, determining the ‘next best probability’ level to execute against may be of immense value, specifically by helping to determine the best potential times and levels to commit capital.
The blue and red horizontal lines on the chart represent a next-best-probability buy re-entry range and a next-best-probability sell re-entry range over the short term. The ranges assume no existing position is being held by a trader, while the probabilities are based on several factors, which may include:
Short-term ratings and medium-term regimes
Momentum indicators
Horizontal or diagonal support and resistance
Candle structure
Moving averages and standard deviation
Please note that these are short-term levels and may contrast with medium- and long-term outlooks, which are based on the weekly and monthly charts and are generally more applicable to long-term investors. These levels are subject to change based on market sentiment, subsequent price action, and company/sector-specific or macroeconomic news flow. As always, while the levels are outlined to guide your capital deployment, traders should be prepared to adjust in real-time based on the aforementioned factors.
THE TACTICAL TRADING GUIDE (PRICE ACTION MODEL): UNCOVER OPPORTUNITIES & ASSESS REWARD-TO-RISK
It helps helps clients determine and shed light on the some of the following:
The CURRENT TECHNICAL POSITION and a PRICE ACTION PROBABILITY for multiple time frames.
Three (3) ‘trading’ time frames are considered: Short Term (1 to 10 days) / Medium Term (2 to 4 weeks) and Long Term (5 to 8 weeks)
Whether the reward-to-risk is attractive for a buy/long position
Whether a share is weak. In this case, wait until the price stabilizes before looking to enter (i.e. want until it stops going down)
Whether aggressive buying is underway. In this case, do not ‘chase’ (do not buy) but instead wait for a pullback to re-enter a buy or an overextension with deteriorating candle structure to sell/short.
Whether a trader can look to buy a pullback into a key moving average (continuation trade)
Whether a share needs to break a range for a new trend to be determined (bullish or bearish)
Whether a traders needs to monitor for a change of character that could lead to a bullish or bearish reversal
Whether a share could start a consolidation phase or before continuing it’s bullish or bearish trend
Whether the upward momentum is slowing (if it's in a bullish phase)
Whether buyers can look to 'phase in' to a position (if it's in a bearish phase)
Whether a share lacks directional bias.
The data set is available in real-time (on request)
The readings are subject to change as the price action develops.
Lester Davids
Senior Investment Analyst: Unum Capital


Comments