
+1000 Points

This research note is free.
Please Note: When Published Intraday (JSE Equities), Prices Are Delayed By 15 Minutes.
Update: JSE Top 40 Index: The index traded into the short term buy re-entry range, giving active traders an opportunity to build a position for a an intraday rebound.

Previous Post (Sunday, 13 September): Trading JSE Top 40 Index: Actionable Areas + Long/Short Risks
The analysis below was generated automatically, using an artificial intelligence tool (using my own inputs/data).
🟧 Base Case: ⬜ Neutral
The J200 remains pinned within a choppy, directional consolidation corridor over the short term. A range-bound 14-day trend and an overarching lack of directional bias keep the index oscillating aimlessly between its defined trading boundaries. Near-term bounces toward the upper boundary of the consolidation phase meet rotational supply, while tests of lower support attract tentative dip-buyers. The index continues to digest recent weakness in a neutral holding pattern, waiting for a definitive expansion in market breadth or a high-volume range breakout before establishing a sustained directional move.
Risks to Base Case: Consolidation ranges can break abruptly—either through an unexpected macro catalyst driving an aggressive breakout over range resistance or through an acceleration of short-term selling that forces a breakdown below the consolidation floor.

Risks to Immediate Buy/Long Positions: The immediate short-term trend is classified as "Very Weak." Buying prematurely before price action structurally stabilizes on lower timeframes leaves long exposure exposed to ongoing downside drift and range-floor failure.
Risks to Immediate Sell/Shorts Positions: Initiating short positions into the lower half of an established, range-bound channel carries poor risk-to-reward; any sudden base-building or defense of the range floor can trigger a swift mean-reversion squeeze back toward the middle of the band.
Lester Davids
Senior Investment Analyst: Unum Capital
READY TO TRADE: ACTIONABLE AREAS
For active traders who look to generate cash flow on a continuous basis, determining the ‘next best probability’ level to execute against may be of immense value, specifically by helping to determine the best potential times and levels to commit capital.
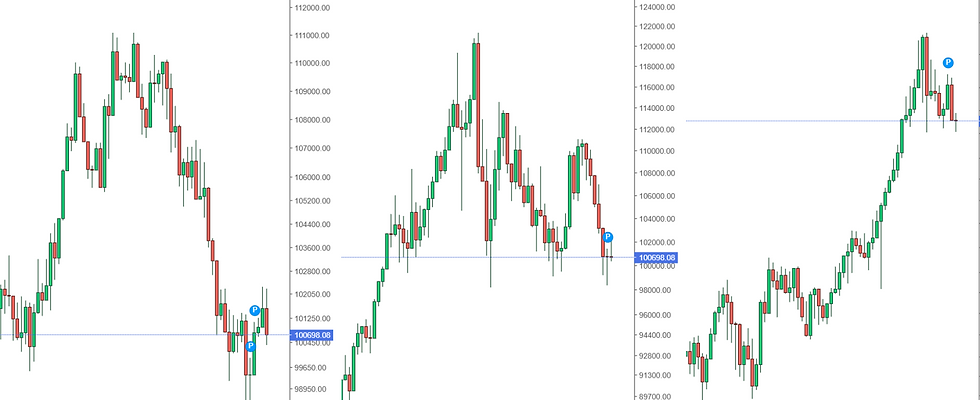
The blue and red horizontal lines on the chart represent a next-best-probability buy re-entry range and a next-best-probability sell re-entry range over the short term. The ranges assume no existing position is being held by a trader, while the probabilities are based on several factors, which may include:
Short-term ratings and medium-term regimes
Momentum indicators
Horizontal or diagonal support and resistance
Candle structure
Moving averages and standard deviation
Please note that these are short-term levels and may contrast with medium- and long-term outlooks, which are based on the weekly and monthly charts and are generally more applicable to long-term investors. These levels are subject to change based on market sentiment, subsequent price action, and company/sector-specific or macroeconomic news flow. As always, while the levels are outlined to guide your capital deployment, traders should be prepared to adjust in real-time based on the aforementioned factors.


Comments