
JSE Top 40 Index

+35 Take Profit Opportunities: Our Capabilities > https://www.unum.capital/post/capabilities
Free Content: July 2026 > https://www.unum.capital/post/rjuly2026
Trade Local & Global Financial Markets with Unum Capital.
To get started, email tradingdesk@unum.co.za
NOTE: When Published Intraday (JSE Equities), Prices Are Delayed By 15 Minutes
INSTRUMENT: J200 (JSE Top 40 Index)
DATE & TIME: Monday, July 20, 2026 | 8:50:04 PM

STRUCTURAL RATING: ⭐⭐☆☆☆ The reward-to-risk profile is currently heavily skewed by deteriorating momentum. For a Buy/Long position, the reward-to-risk is Poor 🟥 because both the 7-day and 14-day trends are weak and bearish, dictating absolute patience until price action stabilizes on lower time frames. Conversely, for a Short/Sell position, the reward-to-risk is Appealing 🟩 due to the localized breakdown in the broader upward macro trend; this structural weakness presents a defined tactical setup to utilize reflexive rebounds into the 8, 21, or 50-EMA overhead resistance layers as a prime sell-short zone.
TACTICAL ACTION SCALE
🟥 At/approaching sell/reduce
🟠 Sell on sharp rally
🟨 Sell on rally ⬅️ J200 IS POSITIONED HERE
🟧 Sell (continuation)
⬜ Neutral
🟦 Buy (continuation)
🟢 Buy on pullback
🔵 Buy on deeper pullback
🟩 At/approaching buy/add
RATIONALE: While the long-term baseline is technically still classified as an upward trend, the current 7-day and 14-day structures are decidedly "Weak" and "Bearish." Because the overarching momentum has notably weakened, long positions must be avoided. Instead, the optimal tactical execution is a Sell on rally, requiring market participants to wait for upward reflexive bounces back into dynamic resistance zones (specifically the 8, 21, or 50-EMA) to establish high-probability short exposure against the deteriorating near-to-medium-term momentum.
SCENARIO MATRIX (BASE, BEAR & BULL CASE)
Base Case (60% Probability):
Near-Term Heavy Drift: Price action fails to stabilize on lower time frames in the short-to-medium term, remaining capped under strong bearish distribution layers. Reflexive rallies lack genuine volume support and are firmly rejected upon testing the overhead 8, 21, or 50-EMA bands, allowing sellers to maintain technical control and grind the index lower into established support shelves.
Bear Case (25% Probability):
Accelerated Trend Breakdown: Localized selling pressure intensifies, completely bypassing any near-term stabilization zones. The index suffers a severe velocity expansion to the downside, which prevents dynamic EMAs from being back-tested as resistance and ultimately threatens to permanently fracture the structural long-term upward trend baseline.
Bull Case (15% Probability):
Lower Time Frame Floor Validation: The "Very Weak" near-term regime abruptly exhausts as strong institutional bids emerge, validating immediate price stabilization. Momentum rapidly accelerates to force a clean, high-volume break back above the 8, 21, and 50-EMAs, neutralizing the localized bearish structures and re-aligning the index with its broader, structural long-term upward trend.
What Can Go Right From Current Levels (Risk For Short Sellers)
For Existing Sell/Short Positions:
Macro Trend Resurgence: Existing shorts are ultimately fighting a longer-term baseline that is still officially identified as an upward trend. If the localized weakness rapidly stabilizes on lower time frames and price fiercely reclaims the 50-EMA, the broader cyclical regime could shift back to an active bull phase, triggering cascading stop-loss execution and turning paper profits into forced buying.
For Potential (New) Sell/Short Positions:
Front-Running the Rebound: The structural model specifically dictates using "Rebounds Into The 8, 21 or 50-EMA" to build short exposure. Initiating fresh bearish positions directly into current depressed levels, rather than waiting for an upward mean-reversion into those defined resistance layers, exposes new capital to unnecessary upward variance and a compromised entry price.
What Can Go Wrong From Current Levels (Risk For Buys/Longs)
For Existing Buy/Long Positions:
Cascading Tactical Breakdown: Investors holding legacy long positions face an uncomfortable capital draw as both the 7-day and 14-day trends remain demonstrably weak and bearish. Because the overarching structural trend has notably weakened, long holders risk enduring a grueling multi-week contraction if lower time frame stability fails to materialize quickly.
For Potential (New) Buy/Long Positions:
Catching a Falling Knife: Entering fresh allocations at current levels actively fights dominant downward velocity. The technical model strictly requires capital to "Wait Until It Stabilizes On The Lower Time Frame." New buyers stepping in prematurely lack a verified structural floor or defensive architecture, exposing the portfolio to immediate negative drift and highly compromised capital efficiency.

READY TO TRADE: ACTIONABLE AREAS
For active traders who look to generate cash flow on a continuous basis, determining the ‘next best probability’ level to execute against may be of immense value, specifically by helping to determine the best potential times and levels to commit capital.
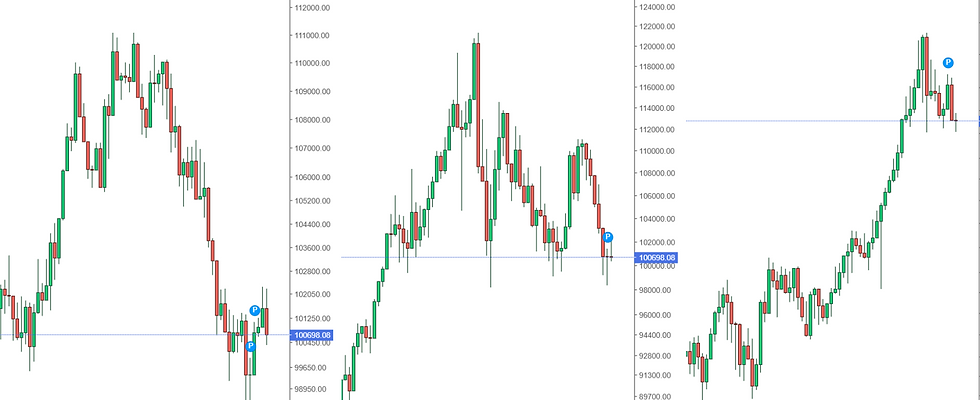
The blue and red horizontal lines on the chart represent a next-best-probability buy re-entry range and a next-best-probability sell re-entry range over the short term. The ranges assume no existing position is being held by a trader, while the probabilities are based on several factors, which may include:
Short-term ratings and medium-term regimes
Momentum indicators
Horizontal or diagonal support and resistance
Candle structure
Moving averages and standard deviation
Please note that these are short-term levels and may contrast with medium- and long-term outlooks, which are based on the weekly and monthly charts and are generally more applicable to long-term investors. These levels are subject to change based on market sentiment, subsequent price action, and company/sector-specific or macroeconomic news flow. As always, while the levels are outlined to guide your capital deployment, traders should be prepared to adjust in real-time based on the aforementioned factors.
THE TACTICAL TRADING GUIDE (PRICE ACTION MODEL): UNCOVER OPPORTUNITIES & ASSESS REWARD-TO-RISK
It helps helps clients determine and shed light on the some of the following:
The CURRENT TECHNICAL POSITION and a PRICE ACTION PROBABILITY for multiple time frames.
Three (3) ‘trading’ time frames are considered: Short Term (1 to 10 days) / Medium Term (2 to 4 weeks) and Long Term (5 to 8 weeks)
Whether the reward-to-risk is attractive for a buy/long position
Whether a share is weak. In this case, wait until the price stabilizes before looking to enter (i.e. want until it stops going down)
Whether aggressive buying is underway. In this case, do not ‘chase’ (do not buy) but instead wait for a pullback to re-enter a buy or an overextension with deteriorating candle structure to sell/short.
Whether a trader can look to buy a pullback into a key moving average (continuation trade)
Whether a share needs to break a range for a new trend to be determined (bullish or bearish)
Whether a traders needs to monitor for a change of character that could lead to a bullish or bearish reversal
Whether a share could start a consolidation phase or before continuing it’s bullish or bearish trend
Whether the upward momentum is slowing (if it's in a bullish phase)
Whether buyers can look to 'phase in' to a position (if it's in a bearish phase)
Whether a share lacks directional bias.
The data set is available in real-time (on request)
The readings are subject to change as the price action develops.
Lester Davids
Senior Investment Analyst: Unum Capital


Comments