Momentum Report + Price Action Model: JSE Top 40 Index
- Lester Davids

- Mar 22
- 1 min read
Research Notes March 2026 > https://www.unum.capital/post/rmar2026
Trade Local & Global Financial Markets with Unum Capital.
To get started, email tradingdesk@unum.co.za
The index has breached it's 21-week exponential moving average (EMA) and has found support on it's rising 200-day simple moving average, albeit with very weak/poor candle structure. While this first re-test of the 200-day SMA is likely to encourage medium term buying, the index remains vulnerable to a potential breakdown below the 200-day SMA toward the swing low/support. Considering the candle structure over the past three weeks, our analysis reflects a sharp bearish reversal and a rapid change in sentiment, although this is not unexpected considering the previous excessive overbought conditions near the 120,000 point level. In the short term, the index trades in a high bearish momentum phase which would is likely to see transition to oversold followed a by a minor rebound.
JSE TOP 40 INDEX: DAILY CHART

Analyst's Price Action Model:

JSE TOP 40 INDEX MONTHLY CHART - SHARP PULLBACK ITNO CHANNEL:

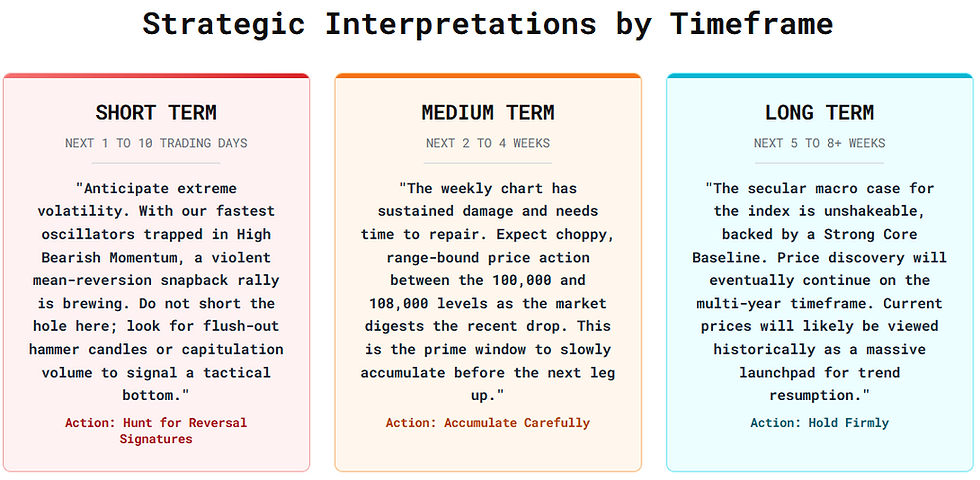
MULTI-TIME FRAME MOMENTUM ANALYSIS:
ANALYST DISCLOURE: THE GRAPHICS BELOW HAVE BEEN GENERATED GOOGLE'S ARTIFICIAL INTELLIGENCE TOOL, BASED ON THE ANALYST'S OWN DATA.


Lester Davids
Senior Investment Analyst: Unum Capital


Comments