JSE Top 40 Index
- Lester Davids

- 1 day ago
- 2 min read
Take Profit Opportunities: Our Capabilities > https://www.unum.capital/post/capabilities
Free Content: June 2026 > https://www.unum.capital/post/rjune2026
Trade Local & Global Financial Markets with Unum Capital.
To get started, email tradingdesk@unum.co.za
NOTE: When Published Intraday (JSE Equities), Prices Are Delayed By 15 Minutes
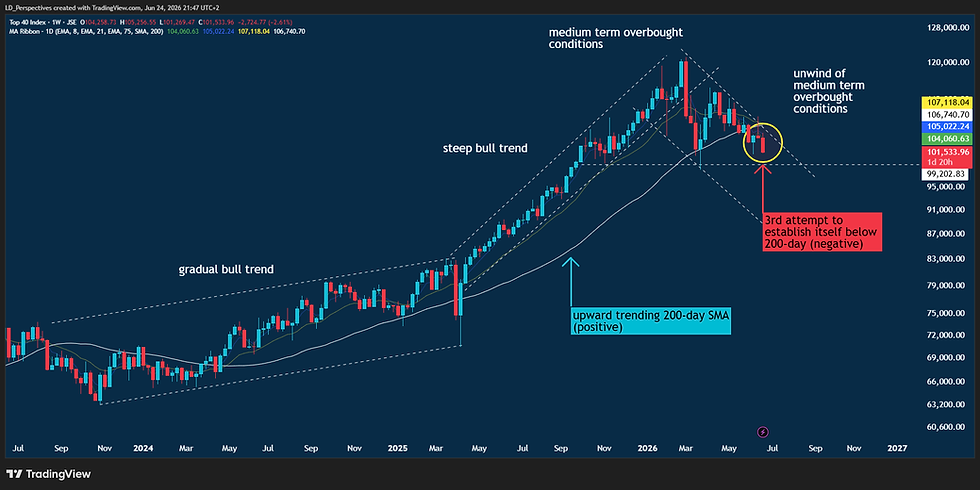
Based on the Daily Chart for the JSE Top 40 Index, the reward-to-risk profile has deteriorated significantly as the index accelerates into a steep liquidation phase. The upside reward potential is currently low 🟥 because overhead supply continues to cap any relief rallies, with recent structural breakdowns turning former support zones into heavy resistance ceilings. Conversely, the downside risk is elevated 🟥. The failure to establish a higher low dictates that the path of least resistance remains firmly downward, leaving the index vulnerable to further capitulation toward deeper demand floors.
The Last Day Candle Structure confirms this ongoing distribution. The session formed a long bearish expansion candle 🟥, opening near its highs and closing at the absolute lows of the day, signaling total seller dominance and an absence of dip-buying interest. Looking at the Last 5 Days Candle Structure, the index exhibits a severe cascading sequence where a minor consolidation was aggressively sold into, trapping counter-trend participants. The Last 10 Days Candle Structure reveals a failed relief rally that has now broken decisively to the downside. Zooming out to the Last 3 Months Candle Structure, the market has clearly transitioned from a structural top into a volatile descending channel, defined by persistent lower highs and lower lows.
The trend’s steepness and slope reflect an aggressive unwinding of long positions. The angle of descent is steep, tracking at roughly 60 to 70 degrees downward 🟥. Consequently, the immediate trend remains firmly bearish 🟥, with the price action decoupling negatively from all short-term moving average baselines.
In terms of the Momentum Profile, the oscillators confirm a structurally weak market. The Ultra Short Term momentum is pointing down and is classified as WEAK 🟥. Similarly, the Short Term momentum is pointing down and sits in WEAK 🟥 territory. Moving to the medium-term picture, the Mid Term momentum is strictly categorized as WEAK 🟥, confirming that the multi-day structural momentum has lost all bullish alignment and is actively driving this downward leg. Finally, the Base Term momentum has transitioned into WEAK 🟥 territory, validating that the underlying trend foundation is actively accommodating this corrective phase.
Lester Davids
Senior Investment Analyst: Unum Capital


Comments