
JSE Top 40 Index

Date & Time: Friday, 25 September 2026 at 09h36
Disclosure: The commentary below was compiled using an artificial intelligence tool, based on my own inputs/data.
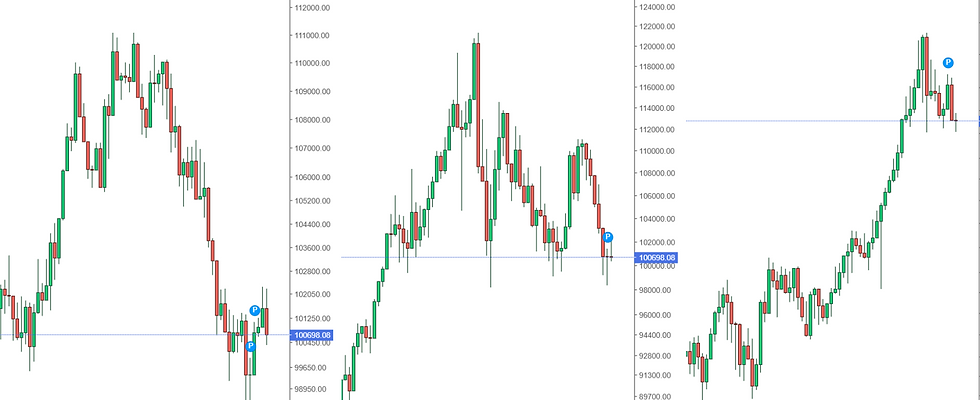
Currently, price action for the JSE Top 40 Index is under active downward pressure, trading near the 103,208 level as the daily candle pushes toward its intraday lows. Sellers retain firm initiative control of the tape, with the day opening at its high of 103,823 and expanding steadily lower. Downside momentum remains dominant, characterized by a persistent sequence of bearish real bodies and a distinct lack of responsive bidding at intermediate price levels

.
Immediately prior to this descent toward the 103,000 threshold, the index executed a clean breakdown below the 106,000 structural shelf. A brief consolidation attempt around the 106,000 – 107,000 zone failed to generate any meaningful upward traction, ultimately resolving in an acceleration to the downside as stop-loss orders beneath the shelf were triggered and sellers reasserted aggressive directional control.
Setting up this downward expansion was a failed retest of major overhead supply in the 110,000 – 111,000 region earlier in September. Buyers staged a multi-week recovery through August, but momentum stalled abruptly at this descending pivot, carving out a prominent lower high and bull trap.
Entrenched institutional supply absorbed the advance, trapping late-stage breakout participants and providing the catalyst for the current liquidation sequence.
Looking at the broader macro structure, this rotation confirms the ongoing corrective phase that has governed the index since peaking near the 122,000 all-time high in March. The structural pattern of descending highs across the second and third quarters has maintained a defensive bias, guiding the index away from intermediate recovery attempts and back toward the primary summer support band situated between 100,000 and 102,000.
Tactical Action: Sell on rally 🟨
3-Day Forecast
The immediate path of least resistance remains downward toward the 102,500 – 103,000 support cluster. While the velocity of the recent decline could induce a short-term pause or shallow technical bounce, any counter-trend drift into the 104,500 – 105,500 area is expected to be met with overhead supply from trapped longs and descending moving averages. Unless buyers can engineer a decisive daily close back above 106,000, rallies offer asymmetric risk-reward for short positioning targeting the continuation of the downtrend.
5-Day Forecast
Over the five-day horizon, the market is poised to test the critical multi-month support floor around the 100,000 – 101,500 baseline established in July. If aggressive selling pressure persists and achieves daily closes beneath 102,000, momentum will likely accelerate into that major demand pool. At that juncture, the market faces a pivotal decision: a high-volume defense and absorption structure could carve out a macro double-bottom, whereas a structural breakdown below 100,000 would signal an extension of the macro correction toward deeper value areas.
Risks of Entering a Buy/Long Position at Current Levels
Counter-Trend Catching: Entering long here attempts to catch a falling knife in a market dominated by multi-day initiative seller momentum and consecutive red candles.
Absence of a Basing Structure: Price has not printed an exhaustion wick, bullish divergence, or consolidation floor on the daily timeframe to confirm that supply has been absorbed.
Overhead Supply Cliffs: Multiple reclaimed breakdown levels—specifically 106,000 and 108,000—now serve as dense resistance bands where trapped market participants will look to exit at breakeven, restricting upside follow-through.
Risks of Entering a Sell/Short Position at Current Levels
Extended Downside Momentum: The index has declined nearly 8,000 points from the 111,000 peak without an intermediate correction, leaving short-term indicators technically stretched and vulnerable to a sharp mean-reversion squeeze.
Proximity to Structural Demand: Price is rapidly approaching the major 100,000 – 102,000 summer consolidation base, where responsive institutional buyers previously mounted an aggressive, multi-week defense.
Poor Location for Stops: Initiating fresh short exposure near 103,200 requires placing stop-loss orders above 106,000 or 107,000 to avoid normal retracement noise, resulting in an unfavorable risk-to-reward ratio on the trade.
Lester Davids
Senior Investment Analyst: Unum Capital


Comments