JSE Top 40 Index: Choppy & Middle of Range
- Lester Davids

- Mar 29
- 2 min read
Research Notes March 2026 > https://www.unum.capital/post/rmar2026
Trade Local & Global Financial Markets with Unum Capital.
To get started, email tradingdesk@unum.co.za
Published on Sunday, 29 March for Monday, 30 March.
On Wednesday morning, we alerted clients to taking profit on the JSE Top 40 Index, with the price having rebounded more than 6300 points from the buy re-entry range. The index eventually traded about 8000 points higher before giving up those gains on Thursday and Friday. The index remains below the 8-day EMA, 21-day EMA, 75-day EMA and 21-week EMA. The recent short term rebound was off the undercut of the 200-day SMA and 50-week EMA, both of which are acting as a support zone, but remain vulnerable to being breached on the downside, should the candle structure deteriorate from current levels. A rebound from current levels is likely to encounter resistance at the cluster of the 8, 21 and 75-day Exponential Moving Averages.


Previous Post (Wednesday 25 March):
JSE Top 40 Index: Sharp Rally +6300 Points vs Buy Re-Entry Range (Short Term Traders Consider Taking Profits)
Trading into the buy re-entry range with a sharp rebound.

Previous Post (Sunday, 22 March 2026): Momentum Report + Price Action Model: JSE Top 40 Index
The index has breached it's 21-week exponential moving average (EMA) and has found support on it's rising 200-day simple moving average, albeit with very weak/poor candle structure. While this first re-test of the 200-day SMA is likely to encourage medium term buying, the index remains vulnerable to a potential breakdown below the 200-day SMA toward the swing low/support. Considering the candle structure over the past three weeks, our analysis reflects a sharp bearish reversal and a rapid change in sentiment, although this is not unexpected considering the previous excessive overbought conditions near the 120,000 point level. In the short term, the index trades in a high bearish momentum phase which would is likely to see transition to oversold followed a by a minor rebound.
JSE TOP 40 INDEX: DAILY CHART

Analyst's Price Action Model:

JSE TOP 40 INDEX MONTHLY CHART - SHARP PULLBACK ITNO CHANNEL:

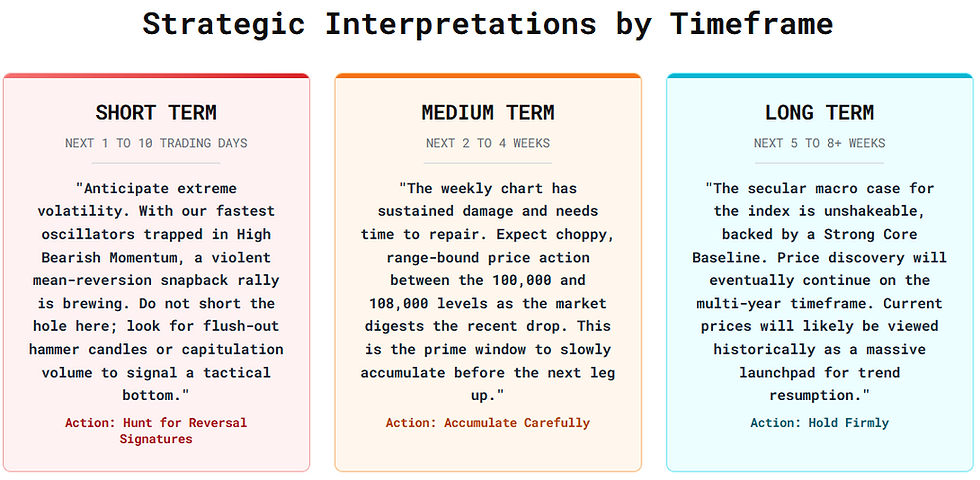
MULTI-TIME FRAME MOMENTUM ANALYSIS:
ANALYST DISCLOURE: THE GRAPHICS BELOW HAVE BEEN GENERATED GOOGLE'S ARTIFICIAL INTELLIGENCE TOOL, BASED ON THE ANALYST'S OWN DATA.


Lester Davids
Senior Investment Analyst: Unum Capital


Comments