
JSE Top 40 Index: Momentum Matrix & Analysis

Research: November 2026 > https://www.unum.capital/post/rnov2026
Date/Time: Friday, 30 October 2026 (Pre-Market)
For our clients trading or holding JSE Top 40 Index.
Disclosure: The graphics & commentary below was compiled using an artificial intelligence tool, based on my own data.
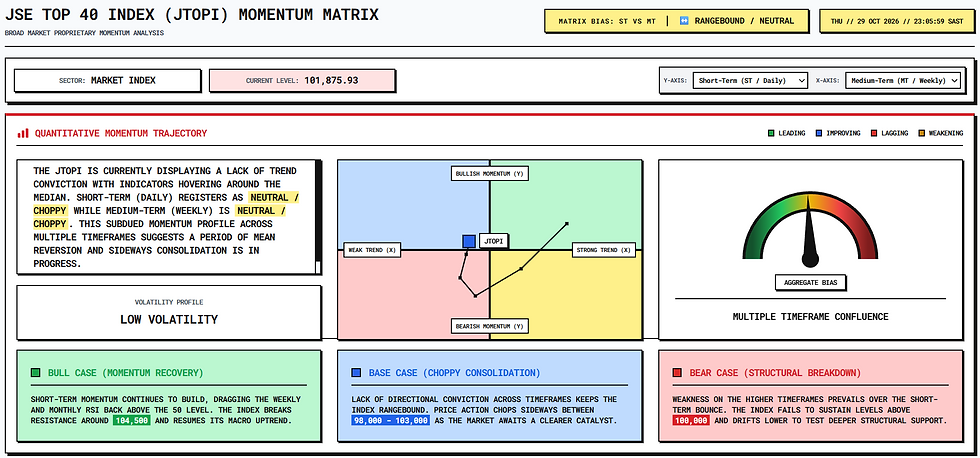

South Africa Top 40 (J200) last close = 101,875.
The index is staging a renewed tactical mean-reversion bounce out of its multi-week demand zone, successfully reclaiming its fast daily momentum ribbon but remaining capped beneath major descending structural resistance. Our overall trend score sits at 48 out of 100, reflecting an improving short-term stabilization effort that must now confront a heavy overhead supply cascade.
Looking at the Probability Assessment, secular structural resilience is providing a floor for tactical recovery attempts. The Monthly (Secular Cycle) outlook maintains its foundational multi-year bull market well above trailing baselines, carrying a 65% bullish probability ⬆️. The Weekly (Structural Trend) view reflects an entrenched intermediate correction navigating below dynamic resistance shelves, holding a 40% bullish probability ↕️. The Daily (Tactical Momentum) timeframe has improved to 55% ⬆️, capturing the recent higher low base near 100,000c and the active push back above the short-term moving average cluster.
This friction is clearly displayed across the Moving Average Slopes. On the daily chart, price action has pushed above the fast dynamic ribbon. The tactical 8-Day EMA (101,435.69c) has flattened and is curling upward to provide immediate dynamic support, while price currently tests directly against the flattening 21-Day EMA (101,817.73c) ⬆️. Overhead, the structural 75-Day EMA (103,869.56c) and primary cyclical 200-Day SMA (107,127.66c) continue to cascade lower in negative alignment, cementing a formidable structural supply zone ⬇️. On the weekly timeframe, price remains pinned beneath the descending 8-Week EMA (102,763.62c), 50-Week EMA (103,562.54c), and 21-Week EMA (104,376.06c) ⬇️. Deep secular baseline support remains anchored far below by the monthly 50-Month EMA (86,392.19c) and the ascending weekly 200-Week SMA (84,190.83c) ⬆️. Qualitative momentum tiers reflect Neutral momentum on the daily profile (RSI at 54.58), while the weekly and monthly horizons remain compressed in lower-neutral defensive bands 🟨. Overall price slope dynamics confirm a localized tactical recovery ⬆️ challenging broader structural ceilings 🔄.
The Candle Structure Profile highlights immediate overhead supply absorption and tactical base defense. The 1-Day structure shows a solid green expansion candle closing near session highs, pressing cleanly off the 100,000c round-number support and pushing through the 8-Day EMA. Looking at the 3-to-5-day profile, the index has carved out a localized higher low compared to the mid-October flush, absorbing selling pressure without surrendering the 100,000c floor. The 10-to-20-day profile shows the index trapped in a volatile lateral range between 98,000c and 104,000c, attempting to transition from directional liquidation into a sustained cyclical base.
Decision Logic: What Is Your Objective?
If your objective is Breakout Momentum Tracking: Wait for a confirmed daily close above the 75-Day EMA (103,869c) and Weekly 8-EMA (102,763c) cluster on expanding volume before scaling into new long exposure.
Key Risk: Buying into a false breakout or bull trap if volume fails to sustain acceptance above these descending structural resistance lines.
If your objective is Mean-Reversion Accumulation: Exercise patience and target structured support tests within the 100,000c – 101,435c support pivot zone where tactical momentum resets.
Key Risk: Catching a falling knife if macro selling pressure abruptly accelerates and breaches the psychological 100,000c horizontal support.
If your objective is Counter-Trend Shorting: Monitor price action strictly for a verified bearish rejection wick or exhaustion pattern against the 102,763c or 103,869c resistance ceilings with negative momentum divergence.
Key Risk: Getting trapped by a sharp short-squeeze or trend continuation if momentum flips to aggressive bullish expansion and reclaims the 75-Day EMA.
What Can Change?
Technical Trigger (Bullish Breakout): A sustained daily close above the 75-Day EMA (103,869c) followed by a weekly close over 104,400c would confirm a broader intermediate trend reversal, invalidating overhead distribution risks and opening a trajectory toward 107,000c+.
Fundamental / Macro Triggers: SARB interest rate policy expectations, global commodity pricing shifts (impacting JSE Resource heavyweights), Chinese stimulus realization, and broader emerging market risk-on sentiment.
Technical Trigger (Rejection / Pullback): A sharp daily reversal candle closing beneath the 8-Day EMA (101,435c) would signal that the tactical bounce has exhausted against overhead resistance, re-engaging downside risk toward the 98,000c double-bottom floor.
Actionable Perspectives & Key Levels From a Mean Reversion standpoint, price is executing a tactical bounce within a broader range; the actionable view is to Trail Stops on Tactical Longs / Monitor 102,763c Resistance 🟨⬆️. From a Momentum perspective, because the primary moving averages remain downward-sloping, the actionable view is to Fade Tactical Relief Rallies into Descending Structural Resistance Bands 🟨 Sell on rally.
Key price boundaries dictating the current structure:
Major Secular / Cycle High Resistance: 120,000c – 122,000c 🔴
Major Intermediate Breakdown Shelf: 110,000c – 112,000c 🔴
Primary Cyclical Baseline (200-Day SMA): 107,127.66c 🔴
Weekly Momentum Resistance (21-Week EMA): 104,376.06c 🔴
Structural Supply Shelf (75-Day EMA): 103,869.56c 🔴
Weekly Structural Barrier (50-Week EMA): 103,562.54c 🔴
Weekly Tactical Barrier (8-Week EMA): 102,763.62c 🔴
Current Price: 101,875.93c ⚪
Tactical Momentum Pivot (21-Day EMA): 101,817.73c 🟢
Immediate Tactical Dynamic Support (8-Day EMA): 101,435.69c 🟢
Psychological Base / Flipped Breakdown Pivot: 100,000c 🟢
Tactical Range Low / October Flush Lows: 98,000c – 98,600c 🟢
Monthly Macro Baseline (50-Month EMA): 86,392.19c 🟢
Secular Cycle Baseline (200-Week SMA): 84,190.83c 🟢
Risks To Entering Buy/Long Positions At Current Levels:
Approaching Dense Overhead Supply Ribbon: Tactical long positions are heading directly into major descending resistance bands at the 8-Week EMA (102,763c) and 75-Day EMA (103,869c), where trapped institutional buyers are positioned to liquidate.
Counter-Trend Exposure Below Cyclical Baseline: Price trades well beneath the downward-sloping 200-Day SMA (107,127c), meaning long exposure operates counter to the dominant intermediate trend structure.
Loss of Tactical Moving Average Floor: A close below the 8-Day EMA (101,435c) risks invalidating the recent base stabilization, opening the door for stop runs back down toward the 100,000c and 98,000c cycle lows.
Risks To Entering Sell/Short Positions At Current Levels:
Active Short-Covering Momentum: Shorting directly into a confirmed higher-low base that has reclaimed its 8-Day and 21-Day EMAs carries severe squeeze risk toward the 103,000c area.
Rising Short-Term Moving Average Support: The 8-Day EMA (101,435c) has flattened and turned upward, providing a dynamic layer of systematic dip-buying cushion that can frustrate fresh short entries.
Unfavorable Risk-to-Reward on Fresh Short Entries: Shorting directly above a defended 100,000c psychological base offers a poor risk-reward asymmetry compared to shorting confirmed exhaustion rejections at higher 75-Day EMA thresholds.


Comments