
🟩🟧Strong Trend / Bullish With Caution. Trend Continuation On Strong Volume Above 2920c

Research Notes May 2026 > https://www.unum.capital/post/rmay2026
Trade Local & Global Financial Markets with Unum Capital.
To get started, email tradingdesk@unum.co.za
PSG Financial Services (KST)

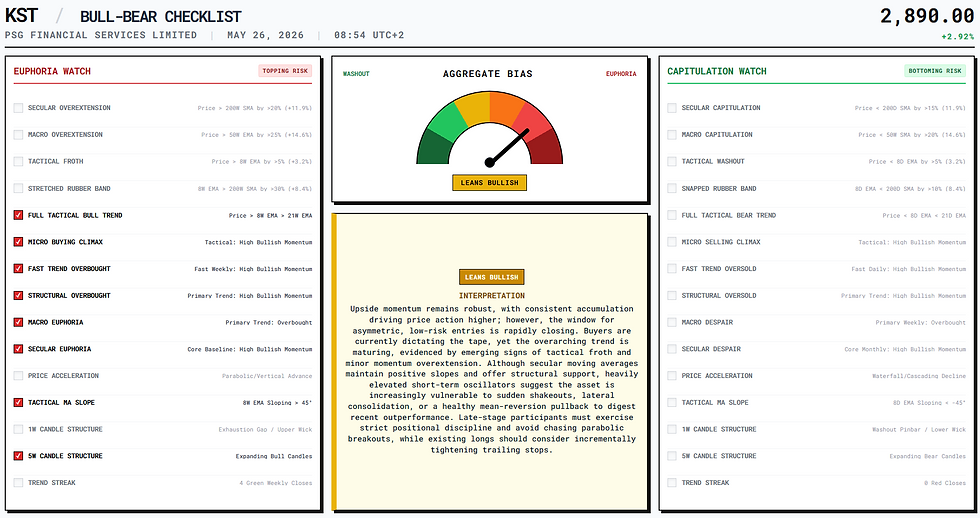
🟩 Macro Breakout | 🟦 Trend Continuation | 🟢 Buy on Breakout
Primary State: Executing a definitive structural breakout to new all-time highs, clearing a horizontal consolidation ceiling with the last close at 2,890 ZAC.
Monthly Pulse: The Monthly momentum registers as High Bullish Momentum, confirming that the secular uptrend is supported by intense institutional conviction.
Weekly Tactical Momentum: The Weekly momentum registers as Strong, confirming the intermediate-term breakout thrust is well-supported and has headroom before reaching overbought territory.
Daily Momentum: The Daily momentum registers as High Bullish Momentum, validating that the immediate breakout velocity is aggressive and attracting fresh capital.
Exhaustion Warnings: While the breakout is robust, the synchronized high-level readings across the daily and monthly timeframes warn that the asset is tactically stretched; a minor consolidation near the breakout zone would be healthy to digest the recent move.
Thesis Summary: KST is displaying a textbook continuation breakout within a multi-year secular bull market. After digesting gains in a horizontal accumulation range, the stock has resolved upward, cleanly clearing overhead supply. This setup signals a high-probability continuation pattern and the start of a new primary impulse wave.
Strategy: Core long-term positions should be held to participate in the ongoing markup. For tactical entry, the current breakout level is viable; utilize the prior resistance ceiling as a new structural support floor.
Reward-to-Risk (R:R) Dynamics: * The Immediate LONG: Favorable R:R. Entering at 2,890 ZAC allows for a tight stop just beneath the breakout axis.
The Pullback LONG: Excellent R:R. A retest of the 2,750–2,800 ZAC support ledge would offer the highest margin-of-safety entry.
Fair Value Support: Immediate structural support has dynamically shifted to the previous resistance ceiling, establishing a floor between 2,750 and 2,800 ZAC.
Structural Floor: The deep, definitive macro structural trend floor remains well-anchored much lower, near the 2,400 to 2,500 ZAC baseline.
Support Zone Mapping: * Immediate Tactical Support (The Breakout Ledge): 2,750 – 2,800 ZAC. The base that must hold to keep the breakout valid.
Secondary Support Shelf (The Range Floor): 2,400 – 2,500 ZAC. The bottom of the multi-month consolidation regime.
Primary Macro Support (The Secular Floor): 2,000 – 2,100 ZAC. The deep historical base supporting the multi-year cycle.
Extension Target: With the asset in price discovery mode, immediate tactical extension targets eye the 3,100 to 3,200 ZAC psychological zones.
Structural Price Forecast: Assuming the 2,750 ZAC breakout axis holds, the measured move objective, projected from the depth of the prior consolidation, points toward a macro target in the 3,500 ZAC area.
Technical Valuation & Variance Matrix: Estimated Technical Fair Value (TFV) sits near the 2,600 ZAC balance point. The asset trades at a moderate momentum premium, standard for a healthy breakout.
Tactical Probability Profile: * 🟩 LONG: Immediate Breakout Continuation | 65% Probability.
🟦 LONG: On Tactical Retest of 2,800 ZAC | 80% Probability.
🟧 SHORT: Tactical Fade | 20% Probability.
Macro Risk: A "false breakout" or bull trap. A swift daily close back below 2,750 ZAC would invalidate the advance and force a retest of the range floor.
What Can Change: * Structural Failure: Close below 2,700 ZAC invalidates the breakout.
Impulsive Re-acceleration: Sustained daily momentum pushing cleanly over 3,000 ZAC accelerates the markup.
Momentum Churn: Price hovers near 2,850–2,900 ZAC, building a high-tight flag.
Structural Breakdown: * 1-Day Structure (Markup): Impulsive resolution out of a horizontal channel.
Weekly Structure (Continuation): Orderly stair-step pattern honoring higher-lows.
Monthly Structure (Secular Shift): Multi-year compounding growth remains intact.
Velocity & Slope Analysis: * 1-Day Slope (Healthy): Approx. +30 Degrees. Sustainable momentum clearing supply.
Weekly Slope (Bullish): Approx. +20 Degrees. Consistent upward bias.
Monthly Slope (Structural): Approx. +15 Degrees. Persistent, stable macro tailwind.
Momentum Profile Integration: The Daily, Weekly, and Monthly momentum tiers are well-synchronized. This profile reflects steady institutional accumulation. The multi-timeframe alignment confirms the breakout is structurally sound and built for sustainable, long-term continuation.
Price Action Model (Tactical View)

READY TO TRADE: ACTIONABLE AREAS
For active traders who look to generate cash flow on a continuous basis, determining the ‘next best probability’ level to execute against may be of immense value, specifically by helping to determine the best potential times and levels to commit capital.
The blue and red horizontal lines on the chart represent a next-best-probability buy re-entry range and a next-best-probability sell re-entry range over the short term. The ranges assume no existing position is being held by a trader, while the probabilities are based on several factors, which may include:
Short-term ratings and medium-term regimes
Momentum indicators
Horizontal or diagonal support and resistance
Candle structure
Moving averages and standard deviation
Please note that these are short-term levels and may contrast with medium- and long-term outlooks, which are based on the weekly and monthly charts and are generally more applicable to long-term investors. These levels are subject to change based on market sentiment, subsequent price action, and company/sector-specific or macroeconomic news flow. As always, while the levels are outlined to guide your capital deployment, traders should be prepared to adjust in real-time based on the aforementioned factors.
THE TACTICAL TRADING GUIDE (PRICE ACTION MODEL): UNCOVER OPPORTUNITIES & ASSESS REWARD-TO-RISK
It helps helps clients determine and shed light on the some of the following:
The CURRENT TECHNICAL POSITION and a PRICE ACTION PROBABILITY for multiple time frames.
Three (3) ‘trading’ time frames are considered: Short Term (1 to 10 days) / Medium Term (2 to 4 weeks) and Long Term (5 to 8 weeks)
Whether the reward-to-risk is attractive for a buy/long position
Whether a share is weak. In this case, wait until the price stabilizes before looking to enter (i.e. want until it stops going down)
Whether aggressive buying is underway. In this case, do not ‘chase’ (do not buy) but instead wait for a pullback to re-enter a buy or an overextension with deteriorating candle structure to sell/short.
Whether a trader can look to buy a pullback into a key moving average (continuation trade)
Whether a share needs to break a range for a new trend to be determined (bullish or bearish)
Whether a traders needs to monitor for a change of character that could lead to a bullish or bearish reversal
Whether a share could start a consolidation phase or before continuing it’s bullish or bearish trend
Whether the upward momentum is slowing (if it's in a bullish phase)
Whether buyers can look to 'phase in' to a position (if it's in a bearish phase)
Whether a share lacks directional bias.
The data set is available in real-time (on request)
The readings are subject to change as the price action develops.
Lester Davids
Senior Investment Analyst: Unum Capital


Comments