Netcare: Long Term Recovery
- Lester Davids

- Jan 1
- 3 min read
Research Notes January 2026 > https://www.unum.capital/post/rjan2026
Trade Local & Global Financial Markets with Unum Capital.
To get started, email tradingdesk@unum.co.za
Instrument: NTC (Netcare)
Sector: HEALTHCARE
Closing Price: 1,584c
1W Change: +0.25%
Multi-Frame Action: 🟢 Bullish (D) 🟢 Bullish (W) 🟢 Bullish (M)
Technical Upside: Resistance at 1,650c.
Target: 1,750c (~10%). Trend Extension.
Momentum Signal: High Bullish (Overbought Watch)
Risk / Invalidation: Close below 1,480c
Valuation: Value / Recovery
Primary Driver: Operational leverage from digitization & share buybacks.
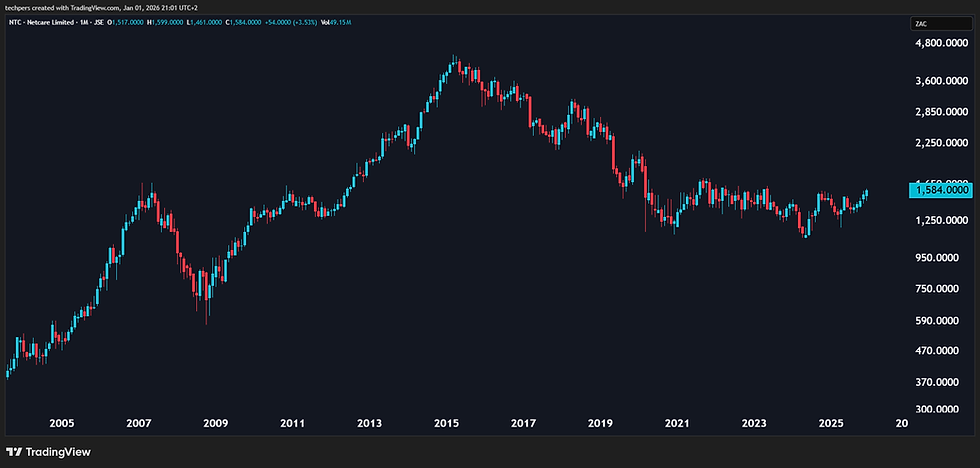
MARKET STRUCTURE & VOLUME VALIDATION Volume Profile: Volume has remained healthy during the ascent, supporting the breakout above the 1,500c level. There is no sign of exhaustion yet, though the pace of buying may slow as it hits overhead resistance. Liquidity Zones: The 1,450c – 1,500c zone is now a critical demand floor (support). Price is extending away from this base. A sustained hold above 1,550c keeps the path open toward the 1,650c – 1,750c liquidity pools. Divergences: No major bearish divergences on the daily, but the weekly indicators are becoming stretched (approaching overbought). This suggests a strong trend that may need a brief consolidation or "flagging" period before the next leg higher.
NTC Monthly Chart
RELATIVE STRENGTH (SECTOR & INDEX) vs. JSE All Share: Bullish. NTC is outperforming the broader index, showing relative strength as the market rotates into defensive growth/value plays. vs. Healthcare Sector: Strong. Netcare is leading or performing in-line with the sector recovery, driven by specific internal efficiency narratives.
SCENARIO ANALYSIS (RISK MANAGEMENT) Bull Case (Primary): The trend is undeniably up across all timeframes. A daily close above 1,600c would clear the last local hurdles, opening a vacuum move toward 1,700c – 1,750c. Bear Case (Alternative): The overbought weekly signals warn of a potential pullback. If price slips back below 1,550c, we could see a rotation down to retest the 1,480c breakout level. A close below 1,480c neutralizes the immediate bullish bias.
MOMENTUM PROFILE:
Daily Chart (Standard) Outlook: Bullish Continuation
Ultra Short Term: Neutral — The 2-period volatility gauge is centering within the neutral band (61.17), allowing price to catch up to the moving averages without breaking the trend. Short Term: Strong — The 3-period indicator is maintaining its position in the “Strong” tier (61.38), confirming active buyer interest on dips. Mid Term: Strong — The 7-period trend is firmly established in the upper bullish zones (64.10). Base Term: Strong — The 14-period baseline (62.04) is rising, supporting the trend.
Weekly Chart (Slower / Macro) Outlook: High Momentum / Overbought
Tactical Momentum: High Bullish — The indicator is elevated in the “High Bullish” tier (91.16), approaching the overbought ceiling. This implies aggressive momentum but limited immediate runway. Fast Weekly: High Bullish — Momentum is exceptionally strong (84.94), sitting in the “High Bullish” zone. Structural Trend: High Bullish — The 7-period structure (76.05) has accelerated into the high momentum bands. Primary Trend: Strong — The long-term baseline (67.87) has crossed into the “Strong” tier, confirming the macro recovery is real.
Monthly Chart (Long Term / Secular) Outlook: Secular Recovery
Quarterly Pulse: Overbought — The ultra-fast monthly pulse (97.63) is maxed out in the “Overbought” tier, reflecting the sharpness of the recent quarter's rally. Fast Monthly: Overbought — Approaching the upper limits (90.02), signaling extreme strength. Secular Cycle: Strong — The 7-period cycle (70.51) is rising through the “Strong” tier. Core Baseline: Strong — The 14-period baseline (59.69) is recovering from the lows and pushing into positive territory.
Lester Davids
Senior Investment Analyst: Unum Capital


Comments