Trading African Rainbow Minerals: 7-Month High + 36% Gain + Updated Model Reading
- Lester Davids

- Jun 11, 2025
- 7 min read
Research Notes For 09 to 13 June > https://www.unum.capital/post/r0913june
Trade Local & Global Financial Markets with Unum Capital.
To get started, email tradingdesk@unum.co.za
Today, the share reached a 7-month high of 18313c which is 36% higher than the initial level of 13390c on 26-February (publication date of research note).
Overall Trading Considerations for African Rainbow Minerals:
Here's a breakdown of the current price action:
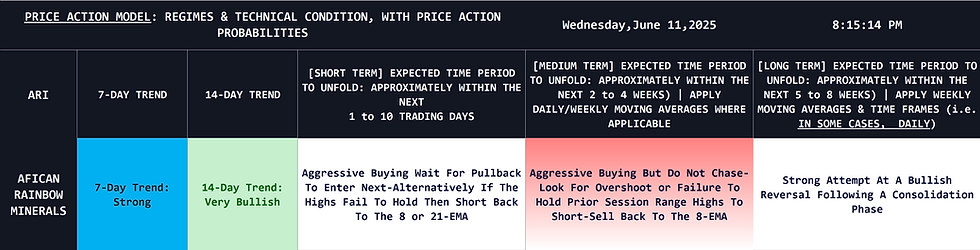
The 7-day trend is indicated as "Strong," while the 14-day trend is "Very Bullish."
Comparison: Both the short-term (7-day) and slightly longer short-term (14-day) trends indicate upward momentum ("Strong" and "Very Bullish" respectively) for the share. This suggests a consistent buying pressure across these timeframes. The "Very Bullish" 14-day trend reinforces the "Strong" 7-day trend, indicating that the recent strength is part of a broader upward movement for African Rainbow Minerals.

Potential Trading Approach:
Short Term (Approximately Next 1 to 10 Trading Days): The model notes, "Aggressive Buying Wait For Pullback To Enter Next-Alternatively If The Highs Fail To Hold Then Short Back To The 8 Or 21-EMA."
Approach: While aggressive buying is present, the recommendation is to wait for a pullback to enter, or if highs fail to hold, to short back to the 8 or 21-EMA. This suggests a "buy the dip" strategy within an overall bullish short-term trend, but with an awareness of potential short-term reversals.
Medium Term (Approximately Next 2 to 4 Weeks): The model indicates "Aggressive Buying But Do Not Chase-Look For Overshoot Or Failure To Hold Prior Session Range Highs To Short-Sell Back To The 8-EMA."
Approach: The medium term also suggests aggressive buying for African Rainbow Minerals, but with a strong caution against chasing the price. It advises looking for overshoots or failures to hold prior session range highs to short-sell back to the 8-EMA. This implies managing risk by taking profits or initiating short positions on extended bullish moves.
Long Term (Approximately Next 5 to 8 Weeks): The model states, "Strong Attempt At A Bullish Reversal Following A Consolidation Phase."
Approach: The long-term perspective for African Rainbow Minerals points to a strong attempt at a bullish reversal following a consolidation phase. This suggests a potential significant upward movement after a period of sideways trading.
Overall Trading Considerations for African Rainbow Minerals:
Consistent bullish momentum: Both short and slightly longer short-term trends are bullish for African Rainbow Minerals, supporting upward price action.
Short-term caution: Despite the buying pressure, the model advises caution in the short term, recommending waiting for pullbacks for buying opportunities and being prepared for short-term reversals if highs don't hold.
Medium-term strategic buying with risk management: The medium term reinforces aggressive buying but emphasizes not chasing the price and looking for opportunities to short-sell on extended rallies back to the 8-EMA for African Rainbow Minerals.
Long-term bullish attempt: The long term shows a strong bullish attempt for African Rainbow Minerals following a weaker trend, indicating a potential significant upward move.
In summary, the current view is bullish across short to medium terms, with a long-term bullish attempt following a consolidation phase. However, traders should be cautious, look for pullbacks as buying opportunities, and manage risk by not chasing the price and being prepared to short-sell extended rallies in the medium term.
The model points to a general upward trend for the price of African Rainbow Minerals.
Previous Post (Monday 26 May): Trading African Rainbow Minerals. Approach + Long Term Target
Strong upside follow-through from 26-Feb note at 13390c.
Falling wedge breakout sees temporary reclaim of the 200-day SMA
Improved candle structure
Short Term: Strong / approaching overbought
Long Term: Strong attempt at a recovery
Key level: ~17250c
Long term target is ~20100c - 20900c (around the 200-week)

For African Rainbow Minerals (ARI), here's a breakdown of the potential trading approach across different timeframes:
Short Term (approx. next 1 to 10 Trading Days):
The model indicates "Very Strong Move Buyers In Control But Don't Chase-May Fail At Attempt To Hold The Highs-If It Doesn't Hold Then The 8-EMA May Be A Short/Sell Target."
Approach: Be cautious of chasing the upward momentum. Look for potential signs of weakness at the highs. If the price fails to hold these highs, the 8-EMA could become a short-sell target. Consider waiting for a pullback or confirmation of failure at the highs before initiating a short position.
Medium Term (approx. next 2 to 4 Weeks):
The model suggests "Aggressive Buying But Do Not Chase-Look For Overshoot or Failure To Hold Prior Session Range Highs To Short-Sell Back To The 8-EMA."
Approach: Similar to the short term, while there's aggressive buying, avoid chasing. Watch for potential overshoots or failure to sustain above prior session highs. These could present opportunities to short-sell, targeting a move back down to the 8-EMA.
Long Term (approx. next 5 to 8 Weeks):
The model describes a "Strong Attempt At A Bullish Reversal Following A Consolidation Phase."
Approach: The long-term outlook suggests a potential bullish reversal. This might warrant looking for buying opportunities on pullbacks or confirmations of the reversal. However, this needs to be considered in the context of the short and medium-term cautions about chasing highs.
Overall Trading Considerations for ARI:
Short-term caution: The model advises against chasing the current buying pressure in the short and medium term, highlighting potential for failure at the highs.
Potential short opportunities: Watch for signs of weakness at the highs in the short to medium term, with the 8-EMA as a potential target for short-selling.
Long-term bullish potential: The longer term suggests a bullish reversal, so any short-term bearish moves could eventually present longer-term buying opportunities if the reversal thesis holds.

Previous Post (22 April): African Rainbow Minerals Running 35% + Updated Model Reading
Current (Live) Price Action Model Reading

Discussed seven weeks ago (Wednesday 26-Feb) at 13390c. Of course, it wasn't the exact low and clients had an even better opportunity to buy as low as ~12800c.
Today it printed a high of 17814c
Well done to clients who latched onto the opportunity.

It's also worth noting the time-stamped model reading on the same day (end of day 26 February), identifying the attractive technical position.

Previous Post (Wednesday 26 February): Trading African Rainbow Minerals: Live Model Reading (Oversold/Attractive)
As the price continues to get sold off aggressively, this model reading might be worth noting.


Previous Post (Tuesday, 25 February End of Day):
My comment a few days ago above R167 was: "short term traders, consider taking profits. It's R140 now!"


Previous Post
Running +9%.
Edit: Closed the day very strong & now running +10%

If you are an ultra short term trader, then a move of this size could be an opportunity bank/take profit, however, for medium term traders, we could be in the early stages of a bigger move.
Also moving perfectly in line with the price action model reading (scrolls down to view).

Previous Post (Sunday, 12 January for Monday 13 January): African Rainbow Minerals: Breaking Out On A Relative Basis (Bullish Setup)
African Rainbow Minerals Relative To The JSE Top 40 Index

African Rainbow Minerals (ARI)


The 7-day trend is strong, and the 14-day trend is rangebound.
Q: What is the overall trend for African Rainbow Minerals in the short term (1 to 10 trading days)?
A: attempting a bullish reversal following a consolidation phase. This suggests a potential upward move in the short term.
Q: What is the medium-term trend (2 to 4 weeks) for African Rainbow Minerals?
A: The medium-term trend is attempting a rebound following a downward trend. This indicates a potential upward movement, but it may consolidate further before continuing higher.
Q: What is the long-term trend (5 to 8 weeks) for African Rainbow Minerals?
A: The long-term trend is range-bound in a weak regime. A recovery buy or long position is triggered on strong bids and a break of the current range high. This suggests a potential upward move, but it may be range-bound for a while.
Q: What are the key takeaways from this price action analysis?
A: The short-term trend is bullish, suggesting a potential upward move. The medium-term trend is attempting a rebound, but may consolidate further before continuing higher. The long-term trend is range-bound, but a recovery buy or long position is triggered on strong bids and a break of the current range high.
Q: What are some potential strategies for trading African Rainbow Minerals based on this analysis?
A: Short-term traders: May look to buy on dips or breakouts in the short term, as the trend is bullish.
Medium-term traders: May look to buy on a break of the current resistance level, as the medium-term trend is attempting a rebound. Long-term traders: May look to buy on strong bids and a break of the current range high, as the long-term trend is range-bound.
Previous Post: African Rainbow Minerals: A +29% Rally; Now Short Term Overbought
Wednesday, 02 October 2024
Time Published: Pre-Market (06h11)
Ticker: ARI
Significant rally off the swing lows of R155 to a high R201.98 during yesterday's session.
Short term traders, take profit or trim some of your position.
Previous Post: Wednesday, 13 September 2024. 11h55
The share has now rallied by R37, with a high of R192.64 today.
Short term/active traders will use these advances to reduce exposure and potentially re-enter at lower levels.
The high was also into my actionable trading zone (sell/reduce), pulling back to R187 on an intraday basis.
Scroll down to see the previous (+original) posts which were communicated to clients of Unum Capital.
The chart is 'current'

Previous Post: 13 September 2024
Update / Pre-Market
Ticker: ARI

Previous Post: 12 September
Real-Time: 10h21
Ticker: ARI
The share has found support at the previous swing low and is rebounding from deeply oversold conditions.
This setup was discussed on Monday, 02 September.
The chart is 'current'

Pre-Market
Ticker: ARI
As per my report on Monday, 02 September (Active Trading Plan), the share is approaching key levels i.e. the previous breakout range and the previous swing lows.
Also note the following, yesterday we saw a 'doji' candle being printed, which may be early clues of a slowdown in downward momentum.
Note: Event risk in the form of earnings at present (Friday, 06 September).
The slide from my report is shown below.

Lester Davids
Analyst: Unum Capital


Comments