Research: Insights & Opportunities - Wednesday, 13 March 2024
- Lester Davids

- Mar 12, 2024
- 4 min read
Updated: Mar 13, 2024
To trade, or open a new account, contact the Unum Capital Trading Desk:
E-mail: tradingdesk@unum.co.za | Call: 011 384 2923
Lester Davids
Analyst: Unum Capital
Good day. Thank you for taking the time to visit this page. My overall goal is to provide you with leading, high quality information by conveying my best interpretation of the most relevant market information in order for you, as a client to: (1) understand the potential opportunities and manage the potential risks and (2) make informed decisions around trading opportunities. To read my full research philosophy, please visit the following link: https://www.unum.capital/post/research-philosophy. To continue reading today’s research, please scroll down.
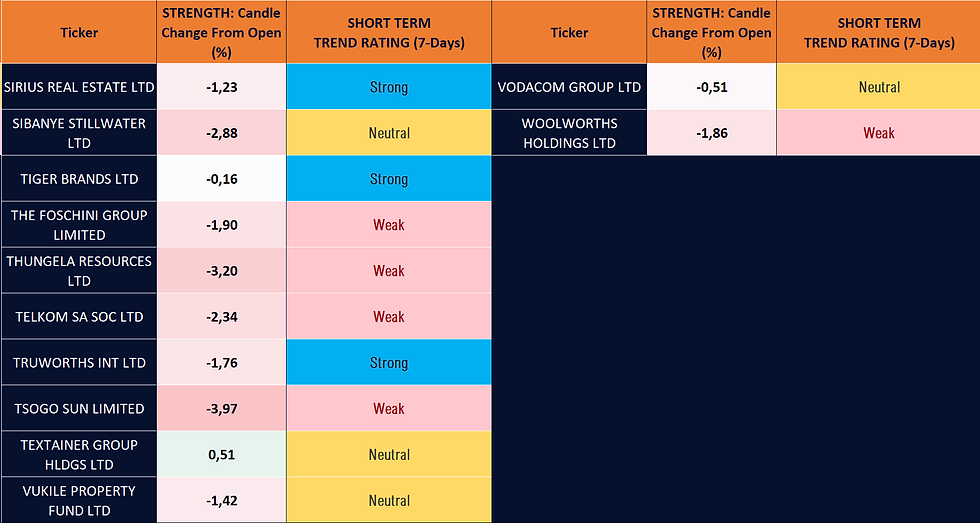
06h30 | JSE Technical Summary: Mid & Large Caps, as of yesterday’s close.
Candlestick Formations form part of technical price charts, which are are used by market participants to interpret current demand-supply dynamics, potential price trends as well as form decisions from these inferences. The tables below highlight the following: (1) The share code (2) the candle's 'change from open’ (over 1 session) i.e. from the start of the first hour of the trading day to the end of the last hour of the trading day'. This is used to determine the strength/weakness of the candle formation i.e. the greater (+) the percentage, the stronger the candle formation and the weaker (-) the percentage, the weaker the candle formation and (3) the share's short term technical rating i.e. which phase the share is in over a 7 day period.
06h30 | HOW TO USE THE RELATIVE SECTOR REGIMES: JSE Technology as an example. This data set is published daily and shows how a sector is performing compared to the broader market (using JSE Top 40 Index as a proxy). Toward the latter part of last week, NPN and PRX (JSE Technology) was trading in an oversold range versus the Top 40 Index. This can be seen with indicator trading in the blue shaded area (value/cheap zone). By trading in this zone, the data suggested that there was an opportunity to possibly buy the sector for a rebound trade. We have since seen NPN and PRX stabilize, with a minor rebound, which gave short term/actives traders an opportunity to profit.
06h30 | JSE Relative Sector Regimes, as of yesterday afternoon.
Top 40, Technology, Diversified Miners, Banks, Insurers
Gold Miners, Platinum Miners, Consumer Staples, Consumer Discretionary, Pharmaceuticals & Hospitals
Coal Miners, Telecoms, Paper & Pulp, Chemicals, Luxury Goods, USD/ZAR
06h30 | CPI Capitec Bank
06h30 | ABG Absa Group
06h30 | HAR Harmony Gold
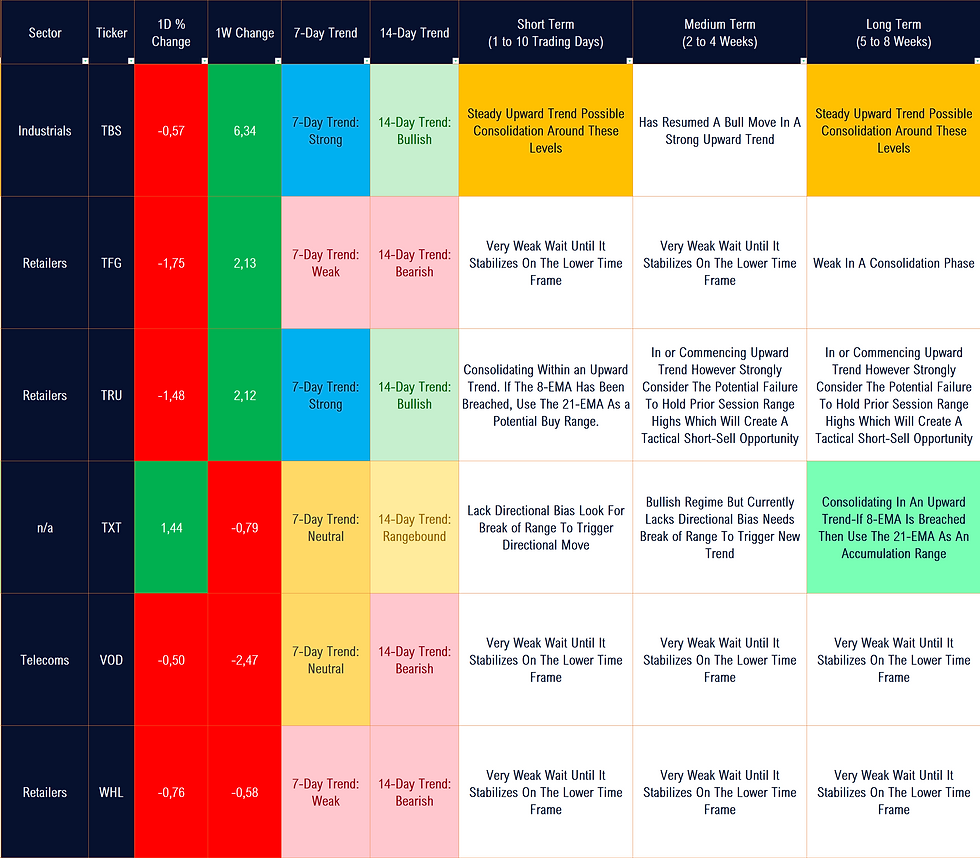
06h30 | 21-EMA Buy/Long Re-Entry (Provisional) | TRU, BVT - See Strategy Slide Below
06h30 | WHL Woolworths | The market was not pleased with Woolworths’ recent update and in my view the share continues to look very weak. Now below all key moving averages. It’s interesting to not that the share is now only 11% above it’s 200-week SMA. Back in August of last year (see 1st chart below) I highlighted the chart which showed the technical risk as the share traded 55% above it’s 200-week SMA. At the time, the share was close to R80! Now in the low R60s (see 2nd connected chart below) …. Charts help to identify opportunity as well as risks.
06h30 | NPN Naspers Ltd (Update) | With reference to the above example of the JSE technology sector, on Friday I highlighted the share + data which looked for a rebound (see research extract below). The share is currently back above R3000, following a sell-off. At the time, the data was as follows: Short Term: “Reward-to-risk becoming attractive for a small buy/long position” and Long Term: “…Expect a small rebound”.
Below is the development of the NPN chart, shown with the signals via the Tactical Trading Guide.
06h30 | Sticking With SA Technology: PRX Prosus has also seen a decent bullish reversal with all 3 time frames pointing toward the probability of a rebound. This data set is published daily.
06h30 | Tactical Trading Guide (Share Commentary on Largest 60 Shares By Market Cap): Technology + Proprietary Insights has helped to develop automated tools and strategies that are used to identify potential trading opportunities as well as highlight potentially significant technical developments across various time frames. This page highlights readings from our Tactical Trading Guide (Price Action Tool) which is also available as a live tool via the telegram group. The tool provides automated price analysis of over 90 JSE-listed equities across 17 sectors and across 3 time frames: short (short term), medium (medium term) and long (long term). Readings are subject to change, based on the development of the subsequent price action.
Lester Davids
Analyst: Unum Capital
Resource Centre
Top Trading Tips: (1) Let The Candle Confirm (Click Here To Read) (2) Failure & Reclaim (Click here To Read) (3) Igniting Bar (Click Here To Read)
Resource Centre (1) Standard Deviation Chartbook Introduction (Click Here) (2) Standard Deviation: Range of Outcomes & Traders Potential Action (Click Here) (3) Optimal Conditions For Bullish & Bearish Trading Setups (Click Here) (4) Core Trading Principles (5) Core Macro Principles
Systematic Insights: Timely Trading Signals Via The Tactical Trading Guide: MTN, MNP, TBS, SBK, DSY, TKG, MTM, HAR, GFI, IMP (Click Here)


Comments