JSE Company Worth R200 Billion: Bull Flag Setup Has Played Out. Now Trading Above R103
- Lester Davids

- Jan 8
- 4 min read
Research Notes January 2026 > https://www.unum.capital/post/rjan2026
Trade Local & Global Financial Markets with Unum Capital.
To get started, email tradingdesk@unum.co.za

SANLAM LIMITED (SLM)
Primary Category: Overbought / Vertical Discovery 🔴
Expected Path: Tactical Reset toward 9,600c Base ⚪
Strategic Overlay: Avoid Chasing / Accumulate on Structural Dips 🟡
Highlights: Sanlam Limited (Multi-Time Frame View)
Fractal Momentum Surge: A powerful "Momentum Trinity" is locked. Ultra Short Term (2-period) indicators on the Daily (93.35), Weekly (95.83), and Monthly (94.86) charts are all simultaneously trading in extreme Overbought tiers. This confirms a concerted wave of institutional and retail buying pressure that has pushed the price into a vertical discovery phase.
Cyclical Turnaround: Sanlam is emerging from a multi-year accumulation phase into a massive cyclical recovery. The Monthly chart shows the Base Term trend reclaiming the "Neutral/Strong" border for the first time in several quarters, suggesting that while short-term action is aggressive, the long-term rally has significant structural runway remaining.
Daily Overheat Warning: The Daily chart is the immediate tactical concern. With the 2-period momentum reading pinned above 93, the stock is statistically overextended in the Short Term (approx. 1 to 10 days). Prices rarely maintain this verticality without a "cooling off" consolidation or a sharp intraday flush to reset oscillators near the 8-day EMA.
The Weekly "Engine Room": The Weekly chart provides the strongest structural evidence for a trend shift. All four trend timeframes are sloping aggressively upward, with the price holding firmly above the 200-week SMA (R86.27). This validates that the medium-term trend has successfully transitioned from bearish to a robust bullish regime.
Breakout at Resistance: Price action is currently challenging major multi-year highs near 10,300c – 10,350c. A definitive monthly close above this pivot technically confirms a secular trend reversal, unlocking higher-order targets toward 11,000c.
Best Action Timeline:
3 to 5 days (1 week): Wait / Trim. Daily RSI readings suggest chasing at record highs is dangerous. Expect choppy price action or a minor pullback to 9,900c – 10,050c.
6 to 10 days (2 weeks): Accumulate. Once the daily "overbought" state cools in the Medium Term (approx. 2 to 4 weeks), look for re-entry near the 75-day ema/21-week ema.
11 to 15 days (3 weeks): Ride the Trend. If the 9,800c zone holds as support, aligned Weekly momentum should drive the next impulsive leg higher toward the 10,500c target.
16 to 20 days (4 weeks): Monitor Monthly Close. A monthly close above 10,250c confirms the secular turnaround is active for the Long Term (approx. 5 to 8 weeks).
Scenarios:
🟢 Bullish Scenario: Blue Sky Breakout: The sheer force of the "Fractal Surge" blows through the 10,350c resistance without pausing, driving price rapidly toward psychological targets at 11,000c.
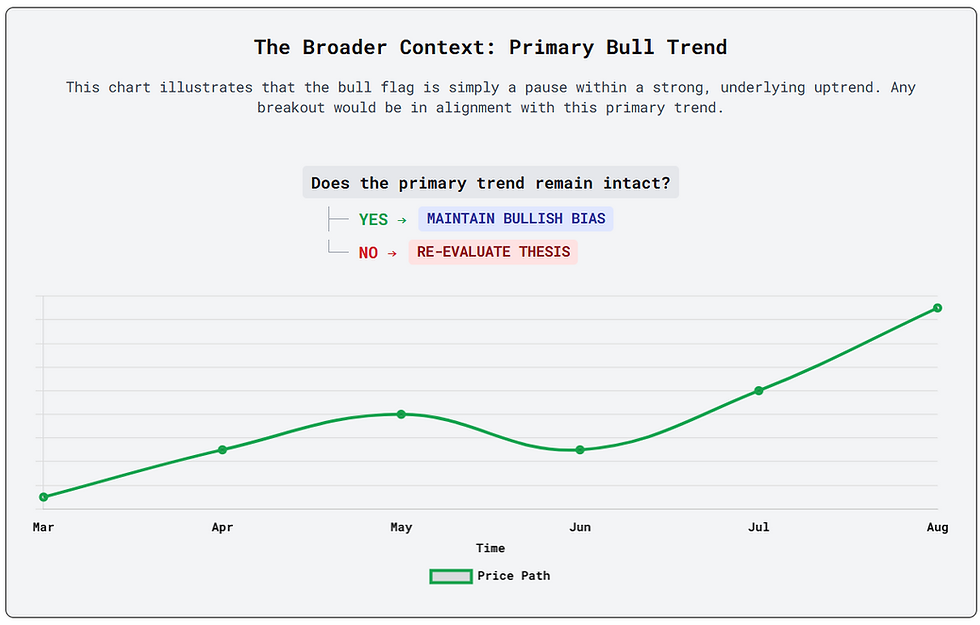
⚪ Base Scenario: Bull Flag Consolidation: The stock pauses at record highs to digest the recent +7% move. Price consolidates between 9,850c and 10,250c, allowing overheated Daily momentum to reset while the 8-week moving average catches up.
🔴 Bearish Scenario: Resistance Rejection: A failure to clear the 10,350c ceiling triggers a sharp reversal back toward the 50-week ema/200-day sma base near 8,700c.
Core Thesis Sanlam is in an "early-stage structural recovery" following years of range-bound weakness. While short-term Daily indicators are flashing Overbought warnings, the long-term macro structure remains far less extended than global peers, offering better risk/reward. The bias is firmly bullish, but tactical patience is required to avoid buying the immediate daily top. Wait for the dip, then trust the weekly trend.
Comprehensive Summary The technical dashboard shows a market transitioning from "bottoming" to "trending". The synchronization of fast-twitch indicators across all three timeframes is a rare signal of total market consensus on the recovery. However, with current prices at a significant premium to the 200-day SMA, the setup favors buying dips rather than chasing vertical breakouts.
Multi-Timeframe Trend Analysis (Weekly Focus)
Ultra Short Term: Indication: EXTREME MOMENTUM | Slope: Sharply Upwards
Short Term: Indication: HIGH BULLISH MOMENTUM | Slope: Sharply Upwards
Mid Term: Indication: STRONG | Slope: Sharply Upwards
Base Term: Indication: STRONG | Slope: Sharply Upwards
Breakouts, Breakdowns, and Reversals
Bullish Confirmation: A weekly close above 10,350c confirms the major multi-year trend reversal.
Bearish Invalidation: A close back below 8,900c would negate the current bullish impulse and suggest the stock is returning to its long-term range.
Key Actionable Zones
Immediate Resistance: 10,334c (Recent 52-Week High).
Target 1: 11,000c (Psychological & Analyst Target).
Pivot Support: 9,850c (Recent Intraday Consolidation Base).
Critical Structural Support: 8,627c (200-Day SMA / Weekly EMA Base).
Update on 04 September: Sanlam: Good Start (+4.5%) But Retracement Sees Price Nearing Stop-Loss Level
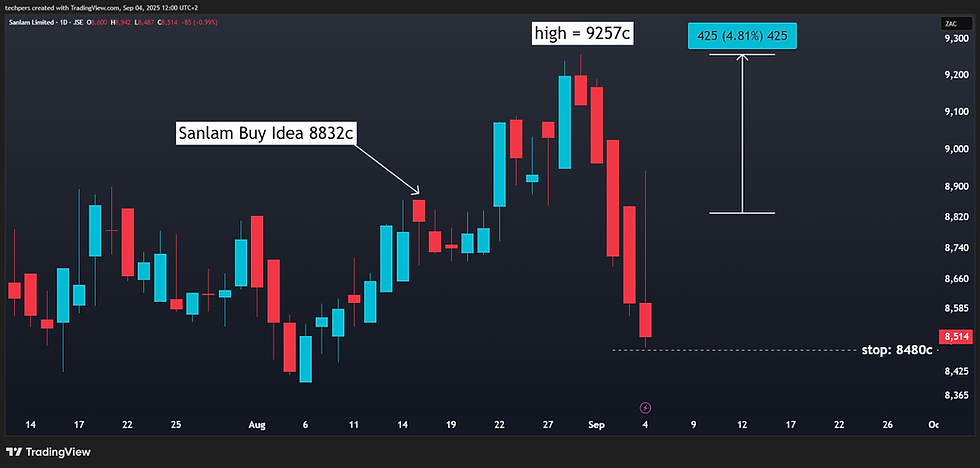
Previous Post (15 August) Sanlam: Bull Flag Setup; Re-Emerging Strength Within a Medium Term Consolidation (High Risk Idea)
Current/Last: 8832c (buy at current levels or better/lower)
Target: 9600c
Stop-loss: 8480c


Lester Davids
Senior Investment Analyst: Unum Capital


Comments