
🟩 JSE Share: Strong Bullish Momentum / Macro Uptrend / Potential For Bullish Continuation

Premium Content > https://www.unum.capital/post/premiumcontent
Free Content: June 2026 > https://www.unum.capital/post/rjune2026
Trade Local & Global Financial Markets with Unum Capital.
To get started, email tradingdesk@unum.co.za
Free Content
Note: When published intraday, JSE equity prices are delayed by 15-minutes.
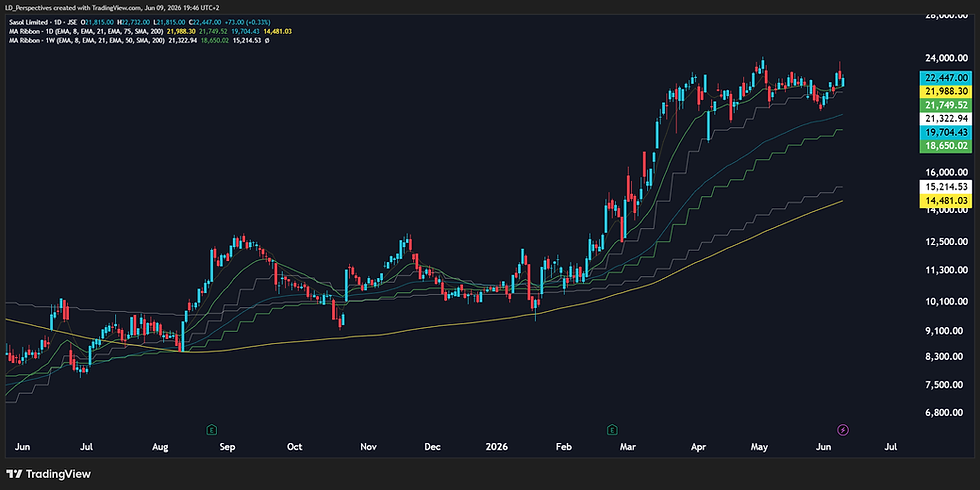
Momentum Regime: 🟩 Strong Bullish Momentum / Macro Uptrend
vs 8-day EMA | 🟩 Above (21,988.30)
vs 21-day EMA | 🟩 Above (21,749.52)
vs 75-day EMA | 🟩 Above (19,704.43)
vs 200-day | 🟩 Above (14,481.03)
vs 21-week EMA | 🟩 Above (21,322.94)
vs 50-week EMA | 🟩 Above (18,650.02)
Candle Structure: 🟩 Strong / Bullish Expansion (Successfully bounced off the 21-day EMA support and is pushing higher)
Next Probability Phase: 🟩 Bullish Continuation / Testing Local Highs
What Can Change?: 🟥 A sharp rejection that closes below the 21-day EMA (~21.7k) and 21-week EMA (~21.3k) support cluster would invalidate the immediate bullish momentum and signal a deeper corrective phase.
Buy/Long Reward-To-Risk: Good (Trading in alignment with a strong macro trend, with a clear and tight invalidation level just below the 21-day EMA) Sell/Short Reward-To-Risk: Poor (Attempting to counter-trend short a chart with full bullish moving average alignment)
Scenario Analysis
Base Case: The price maintains its trajectory above the 8-day and 21-day EMAs, grinding higher to re-test the recent local peaks (around the 23.5k - 24k zone).
Bull Case: Momentum accelerates as the price easily breaches previous local highs. This triggers a breakout, forcing sideline capital to chase and potentially causing a short-squeeze, leading to a steep, impulsive extension higher into price discovery.
Bear Case: The current upward push fails, forming a double top or lower high. Selling pressure forces a decisive daily close below the 21-week EMA (~21.3k). This breaks the short-term uptrend structure, trapping late buyers and initiating a deeper pullback toward the 75-day moving average (~19.7k).
READY TO TRADE: ACTIONABLE AREAS
For active traders who look to generate cash flow on a continuous basis, determining the ‘next best probability’ level to execute against may be of immense value, specifically by helping to determine the best potential times and levels to commit capital.
The blue and red horizontal lines on the chart represent a next-best-probability buy re-entry range and a next-best-probability sell re-entry range over the short term. The ranges assume no existing position is being held by a trader, while the probabilities are based on several factors, which may include:
Short-term ratings and medium-term regimes
Momentum indicators
Horizontal or diagonal support and resistance
Candle structure
Moving averages and standard deviation
Please note that these are short-term levels and may contrast with medium- and long-term outlooks, which are based on the weekly and monthly charts and are generally more applicable to long-term investors. These levels are subject to change based on market sentiment, subsequent price action, and company/sector-specific or macroeconomic news flow. As always, while the levels are outlined to guide your capital deployment, traders should be prepared to adjust in real-time based on the aforementioned factors.
THE TACTICAL TRADING GUIDE (PRICE ACTION MODEL): UNCOVER OPPORTUNITIES & ASSESS REWARD-TO-RISK
It helps helps clients determine and shed light on the some of the following:
The CURRENT TECHNICAL POSITION and a PRICE ACTION PROBABILITY for multiple time frames.
Three (3) ‘trading’ time frames are considered: Short Term (1 to 10 days) / Medium Term (2 to 4 weeks) and Long Term (5 to 8 weeks)
Whether the reward-to-risk is attractive for a buy/long position
Whether a share is weak. In this case, wait until the price stabilizes before looking to enter (i.e. want until it stops going down)
Whether aggressive buying is underway. In this case, do not ‘chase’ (do not buy) but instead wait for a pullback to re-enter a buy or an overextension with deteriorating candle structure to sell/short.
Whether a trader can look to buy a pullback into a key moving average (continuation trade)
Whether a share needs to break a range for a new trend to be determined (bullish or bearish)
Whether a traders needs to monitor for a change of character that could lead to a bullish or bearish reversal
Whether a share could start a consolidation phase or before continuing it’s bullish or bearish trend
Whether the upward momentum is slowing (if it's in a bullish phase)
Whether buyers can look to 'phase in' to a position (if it's in a bearish phase)
Whether a share lacks directional bias.
The data set is available in real-time (on request)
The readings are subject to change as the price action develops.
Lester Davids
Senior Investment Analyst: Unum Capital


Comments