
State of the Chart: October 2026

Updated: 2 days ago
This chart pack was compiled using data from Thursday 01 October and Friday 02 October.
Published: Sunday, 04 October.
Access the full report for R390.
Alternatively, our free/open access content can be accessed at the following link > https://www.unum.capital/post/roct2026
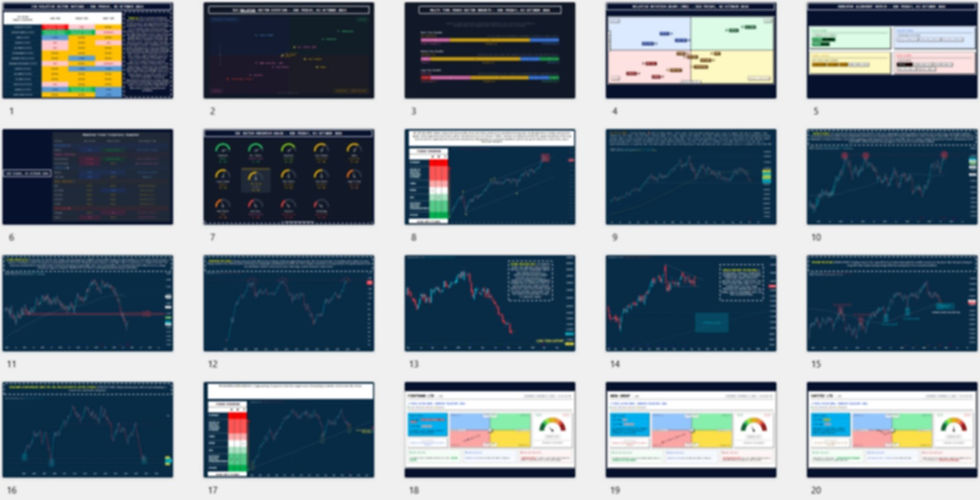

Slide 1: A multi-horizon momentum dashboard providing a high-level summary of sector leadership, highlighting which market segments are entering peak extension phases versus those suffering from structural decay.
Slide 2: A visual rotation scatter plot that categorizes market segments into improving, leading, weakening, or lagging quadrants to track the flow of institutional liquidity.
Slide 3: A multi-timeframe breadth analysis that quantifies market participation, revealing underlying shifts in structural health across short, medium, and long-term horizons.
Slide 4: A Relative Rotation Graph charting the cyclical flow of sectors against a benchmark, offering a visual representation of emerging trends and potential exhaustion points.
Slide 5: A momentum alignment matrix categorizing sectors by their bullish, bearish, or stagnant postures to quickly identify assets with developing strength versus bearish alignments.
Slide 6: A trend trajectory snapshot detailing specific momentum states—such as bullish breakouts, systemic weaknesses, and structural bids—across various market sectors.
Slide 7: A quantitative momentum gauge ranking market segments from highest to lowest strength, distinguishing true market leaders from fading components.
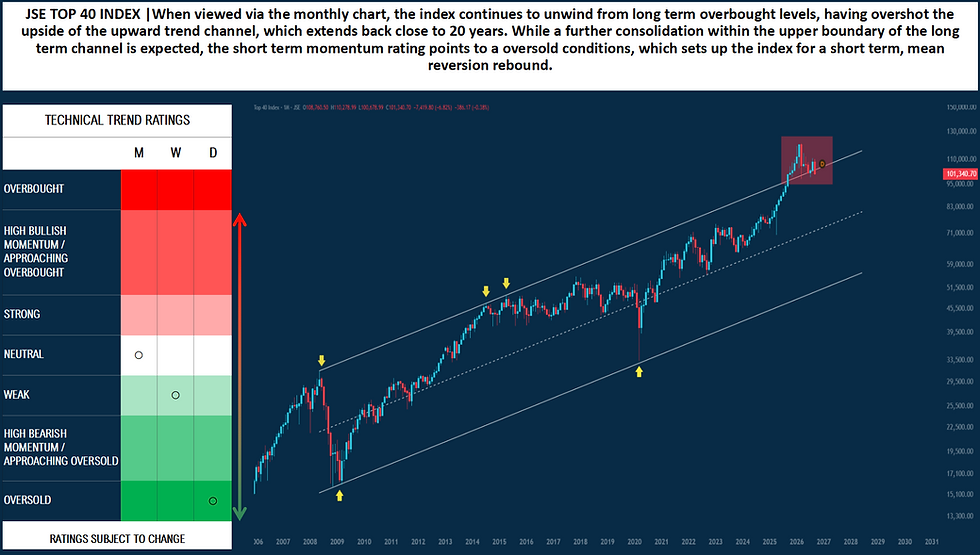
Slide 8: A long-term market index chart utilizing trend channels and technical ratings to pinpoint macro overbought or oversold conditions and potential mean reversion setups.
Slide 9: A shorter-term index analysis highlighting moving average resistance zones, recent tactical rebounds, and expected consolidation ranges near multi-month lows.
Slide 10: An analysis of a specific resource equity, mapping pullback levels against key weekly moving averages to identify high-probability support zones for accumulation.
Slide 11: A review of a consumer equity experiencing a short-term squeeze, defining the precise resistance ranges where buyers and sellers are likely to clash.
Slide 12: An examination of a multi-year outperformer reaching a major macro inflection point, evaluating the diminishing reward-to-risk ratio for new market entrants.
Slide 13: A breakdown of a sharp downward trend in a commodity producer, analyzing indecision in candle structure to spot early signs of stabilization near long-term support.
Slide 14: A technical evaluation of a real estate fund, highlighting bearish reversal patterns and projecting potential re-entry zones along established long-term trendlines.
Slide 15: An assessment of a financial sector asset testing a crucial long-term moving average, determining the viability and key ranges for a potential bullish reversal.
Slide 16: A relative performance ratio chart isolating a specific consumer segment against the broader market to spot macroeconomic inflection points at multi-month swing lows.
Slide 17: A chart analyzing an apparel retail equity approaching a significant long-term trendline, observing lower-timeframe stabilization efforts prior to potential breakouts.
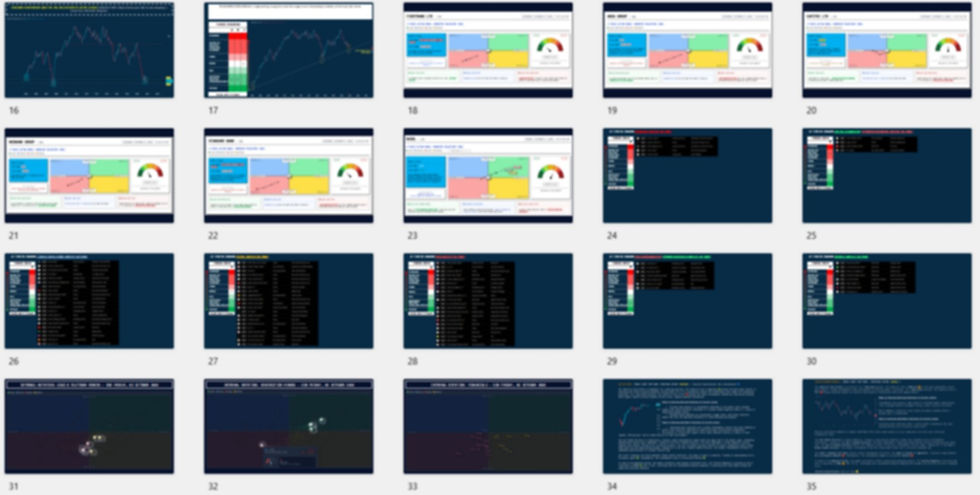
Slide 18: A proprietary price action model for a major financial equity, assessing short-term momentum and aggregate bias to determine if the reward-to-risk ratio justifies a tactical long position.
Slide 19: A momentum trajectory framework for a banking stock, outlining the probability of short-term rebounds against aggressive, established selling pressure.
Slide 20: A trend regime analysis for a consumer finance stock, defining precise tactical buy triggers within a weak structural range.
Slide 21: A momentum teardown of a financial asset, highlighting how slowing bullish momentum on lower timeframes creates potential short-sell zones at key moving averages.
Slide 22: A reward-to-risk evaluation for an institutional banking equity, detailing strict wait-and-see parameters during a heavily oversold markdown phase.
Slide 23: An asset projection model for a diversified industrial equity, identifying tactical short-sell setups at major technical resistance zones.
Slide 24: A technical screening table isolating market equities currently operating in a stretched, monthly overbought state.
Slide 25: A market screen identifying stocks exhibiting high bullish momentum and rapidly approaching overbought extremes.
Slide 26: A comprehensive list of equities possessing strong foundational technical ratings on a long-term timeframe.
Slide 27: A technical summary of equities currently sitting in a neutral, consolidated momentum phase, awaiting a structural catalyst.
Slide 28: A quantitative screen exposing assets operating under weak structural momentum.
Slide 29: A technical dashboard highlighting stocks suffering from high bearish momentum and approaching deeply oversold conditions.
Slide 30: A deep-dive screen into equities that have reached fundamentally oversold technical extremes, prioritizing them for potential mean reversion.
Slide 31: An internal rotation scatter plot for precious metals miners, visualizing the internal shift of sector components between leading and lagging phases.
Slide 32: A sector-specific momentum quadrant mapping the internal weakness and heavy chart structures of diversified resource equities.
Slide 33: An internal rotation matrix for the financial sector, tracking the exact flow of capital across institutional constituents.
Slide 34: A structural timeframe analysis of a major global index, weighing the exact risks of long versus short positioning based on intermediate trend strength and underlying support shelves.
Slide 35: A structural rating breakdown for a commodity stock, analyzing the steepness of its intermediate correction and its weak tactical momentum to warn against premature capital allocation.
Slide 36: A risk-reward profile for a major resource equity, evaluating its orderly accumulation patterns above mid-range support floors.
Slide 37: A tactical classification for a banking stock, outlining the risks of entering long positions prematurely during an aggressive structural markdown.
Slide 38: A comprehensive probability assessment dashboard for a mining asset, scoring the trend based on daily and weekly moving average slopes alongside institutional distribution metrics.
Slide 39: A secular trend evaluation for a consumer defensive equity, tracking the severe breakdown of tactical moving averages against long-term structural support zones.
Lester Davids
Senior Investment Analyst: Unum Capital


Comments