🟩 Model Signal: Spar Group - Deeply Oversold, Early Improvement
- Lester Davids

- Apr 21
- 5 min read
Research Notes April 2026 > https://www.unum.capital/post/rapril2026
Trade Local & Global Financial Markets with Unum Capital.
To get started, email tradingdesk@unum.co.za
Disclosure: The graphics below have been generated using an A.I Tool based on the analyst's proprietary data. The price chart and price action model is the analyst's own.
Updated Price Action Model Reading. See The 5 to 8 Week Time Frame.
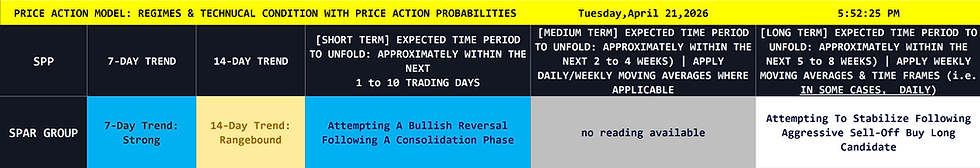

Daily Time Frame (Improving)

Weekly Time Frame (Remains Weak But Has Ability To Improve)


Previous Post (Sunday 12 April 2026): Spar Group: Outlook, Risks & Probabilities

Current Phase: 🔴 Structural Markdown / Capitulation Phase
Next Best-Probability Phase: 🔴 Volatility Compression / Base Building Search
Strategic Overlay: Tactical Exhaustion.

Tactical Risk Assessment: Buying vs. Selling
What's the risk of buying now? You are attempting to "catch a falling knife" in a confirmed macro waterfall. The Monthly oscillators are at absolute zero-bound extremes, indicating a complete collapse in structural demand. While "cheap" on a chart, the momentum has not yet arrested, meaning you risk holding through a final capitulation flush toward the 5,000c - 5,500c liquidity void before any durable floor is established.
What Can Change? If the Daily price structure prints a massive, high-volume bullish "Hammer" or "Piercing" pattern followed by a definitive cross of the Ultra Short Term momentum above the neutral zone, it would signal a tactical "Spring," validating a temporary bottom.
What's the risk of selling now? You are shorting into extreme, multi-year oversold conditions. With the Monthly and Weekly tiers pinned to the floor, the "rubber band" is stretched to its limit. Any minor positive fundamental catalyst could trigger a violent, low-volume "short-squeeze" relief rally of 10-15% just to reset the tactical oscillators.
What Can Change? If the daily price continues to "hug" the lower Bollinger band with declining volume, it mechanically confirms that the sell-side pressure is not yet exhausted and the path of least resistance remains a slow, grinding markdown.
Timeframe Confluence & Forecasting (WCL Model)
1-Month Forecast (🔴 Bearish/Neutral): Driven by 60% Daily / 30% Weekly / 10% Monthly. Daily oscillators are attempting to curl from oversold levels, but the structural weight is overwhelming. We project a period of volatile, low-level chop as the asset tries to find a floor between 5,800c and 6,500c.
3-Month Forecast (🔴 Bearish): Driven by 20% Daily / 50% Weekly / 30% Monthly. The Weekly structural trend is in a vertical decline with no signs of divergence yet. We project continued lower highs as the market digests the structural damage.
6-Month Forecast (🟡 Base Building): Driven by 10% Daily / 20% Weekly / 70% Monthly. The Monthly timeframe is so extremely washed out that a mean-reversion move is inevitable. We project a long-term stabilization phase six months out as the asset attempts to build a multi-month base above 5,000c.
Momentum Profile: The multi-timeframe momentum profile reveals a state of total structural abandonment.
Monthly (Macro): The macro suite is at "Terminus." The fast tiers are essentially flat-lining at zero. While this historically precedes a major long-term bounce, the "slope of hope" is currently vertical to the downside.
Weekly (Structural): Structural oscillators are in a synchronized downward break. There is no evidence of a momentum hook, signaling that institutional distribution is still active.
Daily (Tactical): The daily oscillators are attempting a weak relief reset, but the price is failing to make any upward headway. This is a sign of extreme weakness where the Ultra Short Term, Short Term, Mid Term, and Base Term tiers are failing to produce a unified recovery.
Synthesis: The macro "Gravity" is the absolute dominant force. Tactical bounces are being sold into immediately.

Structural Analysis & Tactical Bias: Evaluating the broader macro context, SPAR has suffered a catastrophic structural breakdown. After failing to hold the 10,000c handle in late 2025, the tape entered a vertical markdown. It has recently sliced through the 8,200c and 6,850c floors. Currently trading at 6,189c, the asset is searching for a bottom in a historical "air pocket." Given the total lack of structural support, the tactical bias is 🔴 Structural Markdown / Capitulation Phase.
Key Support & Resistance Levels: Immediate overhead supply is now heavy at the 6,850c breakdown shelf. Immediate structural support is non-existent on the recent timeframe; the next major historical liquidity pool sits deep at the 5,000c - 5,500c psychological zone.
Next Candle Probability: The price action aligns with Scenario 44: 🔴 High-Level Chop / Bounce Exhaustion. The daily structure shows a series of small-bodied candles at the lows, indicating a temporary pause in the selling, but the lack of a "V-bottom" suggests another leg lower is likely.
Forecast Projection Breakdown: With momentum at terminal lows, the probability distribution favors a final flush followed by a long, painful base-building process.
The Bearish Scenario (55% Probability): The "dead cat" bounce fails to reach 6,500c. Sellers resume the markdown, targeting a final capitulation print near 5,500c.
The Base/Neutral Scenario (35% Probability): The asset enters a wide, volatile stabilization range between 5,800c and 6,300c, slowly grinding sideways to work off the extreme Monthly oversold state.
The Bullish Scenario (10% Probability): A massive capitulation "flush" occurs on record volume, followed by an immediate V-recovery back above 7,000c, signaling the macro bottom is in.
READY TO TRADE: ACTIONABLE AREAS
For active traders who look to generate cash flow on a continuous basis, determining the ‘next best probability’ level to execute against may be of immense value, specifically by helping to determine the best potential times and levels to commit capital.
The blue and red horizontal lines on the chart represent a next-best-probability buy re-entry range and a next-best-probability sell re-entry range over the short term. The ranges assume no existing position is being held by a trader, while the probabilities are based on several factors, which may include:
Short-term ratings and medium-term regimes
Momentum indicators
Horizontal or diagonal support and resistance
Candle structure
Moving averages and standard deviation
Please note that these are short-term levels and may contrast with medium- and long-term outlooks, which are based on the weekly and monthly charts and are generally more applicable to long-term investors. These levels are subject to change based on market sentiment, subsequent price action, and company/sector-specific or macroeconomic news flow. As always, while the levels are outlined to guide your capital deployment, traders should be prepared to adjust in real-time based on the aforementioned factors.
THE TACTICAL TRADING GUIDE (PRICE ACTION MODEL): UNCOVER OPPORTUNITIES & ASSESS REWARD-TO-RISK
It helps helps clients determine and shed light on the some of the following:
The CURRENT TECHNICAL POSITION and a PRICE ACTION PROBABILITY for multiple time frames.
Three (3) ‘trading’ time frames are considered: Short Term (1 to 10 days) / Medium Term (2 to 4 weeks) and Long Term (5 to 8 weeks)
Whether the reward-to-risk is attractive for a buy/long position
Whether a share is weak. In this case, wait until the price stabilizes before looking to enter (i.e. want until it stops going down)
Whether aggressive buying is underway. In this case, do not ‘chase’ (do not buy) but instead wait for a pullback to re-enter a buy or an overextension with deteriorating candle structure to sell/short.
Whether a trader can look to buy a pullback into a key moving average (continuation trade)
Whether a share needs to break a range for a new trend to be determined (bullish or bearish)
Whether a traders needs to monitor for a change of character that could lead to a bullish or bearish reversal
Whether a share could start a consolidation phase or before continuing it’s bullish or bearish trend
Whether the upward momentum is slowing (if it's in a bullish phase)
Whether buyers can look to 'phase in' to a position (if it's in a bearish phase)
Whether a share lacks directional bias.
The data set is available in real-time (on request)
The readings are subject to change as the price action develops.
Lester Davids
Senior Investment Analyst: Unum Capital


Comments