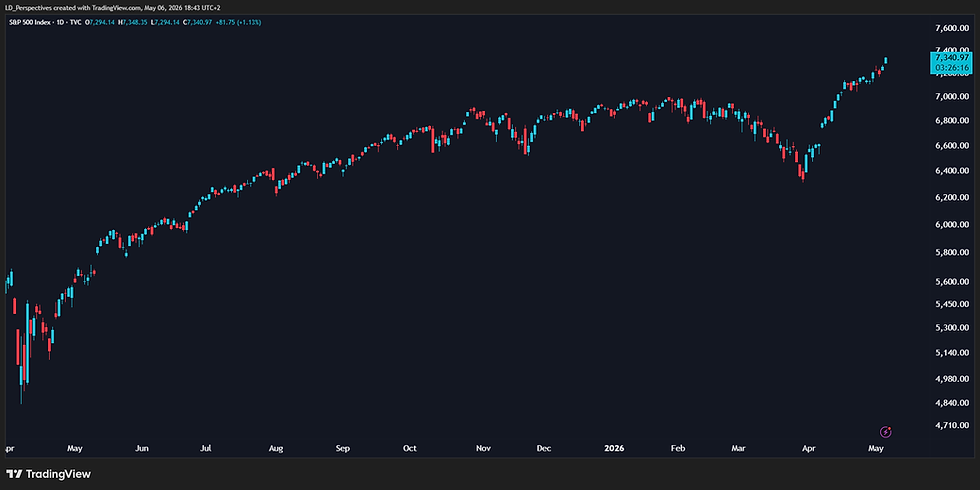
S&P 500 Index: Early Signs of Short Term Overbought Conditions / 🟩 Ride Trend / 🟧 Manage Short-Term Risk
- Lester Davids

- May 6
- 7 min read
Research Notes May 2026 > https://www.unum.capital/post/rmay2026
Trade Local & Global Financial Markets with Unum Capital.
To get started, email tradingdesk@unum.co.za
STATUS OVERVIEW
TECHNICAL CONDITION: 🟩 SYNCHRONIZED UPTREND
CATEGORY: 🟩 BULLISH / TREND FOLLOWING

TREND STATUS
Daily Trend: 🟧 High Bullish / Overbought
Weekly Trend: 🟩 Strong Uptrend
Monthly Trend: 🟩 Secular Strength
Primary Action: 🟩 Ride Trend / 🟧 Manage Short-Term Risk
CORE THESIS: Firing on All Cylinders, Running Hot Tactically
The S&P 500 Index (SPX) is currently exhibiting a dominant, synchronized structural uptrend. The intermediate and long-term momentum profiles perfectly reflect a robust bull market: the Weekly and Monthly structural indicators sit firmly in 'Strong' territory, confirming powerful institutional accumulation without long-term topping characteristics. However, caution is warranted on the tactical scale; the Daily Mid Term momentum is reading 'High Bullish Momentum' and has reached overbought extremes. This suggests the secular tailwinds are fully intact, but the short-term cycle is running exceptionally hot.

Verdict: 🟩 RIDE THE TREND / 🟧 TRAIL STOPS / 🟥 DO NOT CHASE VERTICAL DAILY EXTENSIONS.
STRUCTURAL PROFILE (Based on Core Momentum Data)
DAILY: Mid Term ➔ 🟧 HIGH BULLISH / OVERBOUGHT
WEEKLY: Structural Trend ➔ 🟩 STRONG
MONTHLY: Secular Cycle ➔ 🟩 STRONG
Profile Alignment: The momentum stack tells a story of an advanced and powerful bull market. The structural baseline across Weekly and Monthly timeframes is perfectly aligned in a 🟩 'Strong' posture, providing immense underlying support. The caveat lies in the Tactical Daily chart, which is highly 🟧 elevated and deeply overbought, hinting that while the trend is your friend, short-term exhaustion or a mean-reversion pullback is increasingly likely.
STRUCTURAL TIME FRAME ANALYSIS
🟧 Daily Setup (Approaching the Ceiling): The Daily chart serves as an early warning system for near-term traders. The Mid Term indicator is reading 'Overbought' following a steep, vertical climb. This does not mean an immediate structural crash, but it heavily implies that the asset is vulnerable to a short-term tactical pullback or sideways consolidation to digest the recent surge.
🟩 Weekly Alignment (The Trend Engine): The Weekly chart remains the primary engine driving this index higher. The Structural Trend indicator is resolutely 'Strong'. It recently broke out of consolidation with clear higher highs and higher lows. There are no signs of distribution on this timeframe; it is a textbook hold for trend followers.
🟩 Monthly Strength (Structural Tailwinds): The Monthly chart confirms that the underlying secular cycle is fully supportive of the advance. With the Secular Cycle indicator also printing 'Strong', long-term capital remains highly committed. This structural tailwind acts as a heavy buffer against any significant short-term market shocks.
INTERACTION VERDICT - Dynamic Trend Following: "You do not sell a market with 🟩 'Strong' Weekly and Monthly readings simply because the Daily feels extended. However, the hot Daily pulse means you must transition from aggressive short-term accumulation to strict trend management. 🟩 Ride the strength, but 🟧 implement trailing stops to protect against sudden tactical dips."
CATEGORIZATION & STRATEGY
Daily Timeframe (Mid Term)
Primary Category: 🟧 EXTENDED EXPANSION
Impending Transition: 🟧 MEAN REVERSION / PULLBACK RISK
Strategic Overlay: 🟧 TRAIL STOPS / 🟥 DON'T CHASE
Weekly Timeframe (Structural Trend)
Primary Category: 🟩 STRUCTURAL UPTREND
Impending Transition: 🟩 CONTINUATION
Strategic Overlay: 🟩 BUY MINOR DIPS
Monthly Timeframe (Secular Cycle)
Primary Category: 🟩 SECULAR BULL
Impending Transition: 🟩 PERSISTENT STRENGTH
Strategic Overlay: 🟩 HOLD CORE EXPOSURE
STRATEGIC INTERPRETATIONS BY TIMEFRAME
🟧 TACTICAL (Next 2 to 10 Days): "This is where the warning light blinks. The Daily Mid Term momentum is deeply 'Overbought'. The risk/reward for initiating new, aggressive long positions here is poor. Big-picture forward returns are fine, but near-term chop is highly probable." Action: 🟧 Prepare for Consolidation / Trail Stops
🟩 INTERMEDIATE (Next 2 to 6 Weeks): "The path of least resistance is firmly up. The 'Strong' Weekly trend suggests any sharp daily pullbacks are likely to be met with institutional buying. Utilize those inevitable daily dips to scale into tactical positions." Action: 🟩 Buy Shallow Pullbacks
🟩 STRUCTURAL (Next 2 to 6 Months): "The Monthly baseline is your core anchor. A 'Strong' secular cycle implies a highly favorable holding environment. Let your winners run and do not pre-empt a macro top." Action: 🟩 Let Profits Run
KEY RISKS TO THESIS
🟥 Tactical Rollover (Bear Risk)
Scenario: The Daily 'Overbought' momentum aggressively reverses, triggering a broader market correction that cuts through the 7,200 support tier.
Impact: Late buyers who chased the 7,300+ breakout get caught in a swift, sharp drawdown before the structural Weekly trend has a chance to catch up and provide support.
🟩 Blow-Off Top (Bull Risk)
Scenario: The index ignores the extended Daily state and enters a true 'melt-up' toward 7,500 and beyond.
Impact: Prematurely taking profits or hedging because the Daily timeframe looked "too hot" results in missing a highly explosive, lucrative portion of the breakout.
DECISION LOGIC
Current State: "Synchronized Trending (with Short-Term Overextension)"
Question: Trend Alignment intact?
🟩 Yes (Weekly/Monthly remain 'Strong') ➔ 🟩 RIDE TREND / HOLD CORE
🟧 Neutral (Daily mean-reversion pullback occurs) ➔ 🟩 BUY THE DIP
🟥 No (Weekly breaks market structure) ➔ 🟥 TIGHTEN STOPS HEAVILY
PRICE PROJECTIONS: FORWARD MODELING
🟩 BULL CASE ("Melt-Up Extension"): Target ~7,500 - 7,600 | Probability: 30% The index defies near-term gravity. The Daily Mid Term momentum remains pinned in absolute overbought limits as price goes vertical toward major psychological resistance.
🟧 BASE CASE ("Measured Consolidation"): Target ~7,100 - 7,200 | Probability: 50% The asset digests its recent vertical move. A healthy sideways consolidation or shallow pullback occurs down to the recent breakout zones, alleviating Daily momentum pressure before resuming the uptrend.
🟥 BEAR CASE ("Intermediate Correction"): Target ~6,600 - 6,800 | Probability: 20% A macro catalyst snaps the buying pressure. The Daily trend rolls over hard, forcing a deeper structural correction back toward the primary Weekly support zones established earlier in the year.
SCENARIO PLANNING
🟩 Respecting the Trend: In an environment where Weekly and Monthly indicators are perfectly aligned in 'Strong' territory, attempting to short the market is a low-probability endeavor. You must respect the dominant directional flow.
🟧 Managing the Tactical: However, because the Daily pulse is running at Overbought extremes, blindly buying the current highs is reckless. Transition from a mindset of 'aggressive accumulation' to 'patient entry and trend management'.
EXECUTION PROTOCOL
PRIMARY: 🟩 Ride the Core Trend, 🟧 Manage the Daily Extremes.
🟩 Step 1: Maintain core structural long exposure as long as the Weekly momentum indicator holds its 'Strong' rating.
🟧 Step 2: Cease adding new capital on aggressive daily up-days. Wait exclusively for multi-day pullbacks to alleviate the extreme momentum reading before deploying fresh capital.
🟥 Step 3: Implement a robust trailing stop system on tactical positions to mathematically protect profits in the event the short-term cycle suddenly mean-reverts.
CONCLUSION
The S&P 500 Index requires discipline right now. The structural underpinnings of this rally are magnificent, supported by highly resilient 🟩 'Strong' indicators on both the Weekly and Monthly charts. This dictates that the core strategy must remain heavily biased to the upside. Yet, the tactical landscape requires nuanced risk management; the Daily Mid Term pulse is burning hot. 🟩 Investors should continue to ride this lucrative secular wave, but the time for reckless daily accumulation has passed. 🟧 Secure your base, trail your stops, and wait for the market to cool off tactically before sizing up further.
READY TO TRADE: ACTIONABLE AREAS
For active traders who look to generate cash flow on a continuous basis, determining the ‘next best probability’ level to execute against may be of immense value, specifically by helping to determine the best potential times and levels to commit capital.
The blue and red horizontal lines on the chart represent a next-best-probability buy re-entry range and a next-best-probability sell re-entry range over the short term. The ranges assume no existing position is being held by a trader, while the probabilities are based on several factors, which may include:
Short-term ratings and medium-term regimes
Momentum indicators
Horizontal or diagonal support and resistance
Candle structure
Moving averages and standard deviation
Please note that these are short-term levels and may contrast with medium- and long-term outlooks, which are based on the weekly and monthly charts and are generally more applicable to long-term investors. These levels are subject to change based on market sentiment, subsequent price action, and company/sector-specific or macroeconomic news flow. As always, while the levels are outlined to guide your capital deployment, traders should be prepared to adjust in real-time based on the aforementioned factors.
THE TACTICAL TRADING GUIDE (PRICE ACTION MODEL): UNCOVER OPPORTUNITIES & ASSESS REWARD-TO-RISK
It helps helps clients determine and shed light on the some of the following:
The CURRENT TECHNICAL POSITION and a PRICE ACTION PROBABILITY for multiple time frames.
Three (3) ‘trading’ time frames are considered: Short Term (1 to 10 days) / Medium Term (2 to 4 weeks) and Long Term (5 to 8 weeks)
Whether the reward-to-risk is attractive for a buy/long position
Whether a share is weak. In this case, wait until the price stabilizes before looking to enter (i.e. want until it stops going down)
Whether aggressive buying is underway. In this case, do not ‘chase’ (do not buy) but instead wait for a pullback to re-enter a buy or an overextension with deteriorating candle structure to sell/short.
Whether a trader can look to buy a pullback into a key moving average (continuation trade)
Whether a share needs to break a range for a new trend to be determined (bullish or bearish)
Whether a traders needs to monitor for a change of character that could lead to a bullish or bearish reversal
Whether a share could start a consolidation phase or before continuing it’s bullish or bearish trend
Whether the upward momentum is slowing (if it's in a bullish phase)
Whether buyers can look to 'phase in' to a position (if it's in a bearish phase)
Whether a share lacks directional bias.
The data set is available in real-time (on request)
The readings are subject to change as the price action develops.
Lester Davids
Senior Investment Analyst: Unum Capital


Comments