🟩Aggressive Bull Phase But 🟧Ultra Short Term Momentum Slowing
- Lester Davids

- Jun 3
- 6 min read
Premium Content > https://www.unum.capital/post/premiumcontent
Free Content: June 2026 > https://www.unum.capital/post/rjune2026
Trade Local & Global Financial Markets with Unum Capital.
To get started, email tradingdesk@unum.co.za
S&P 500 Index (SPX500) [7,609.78].
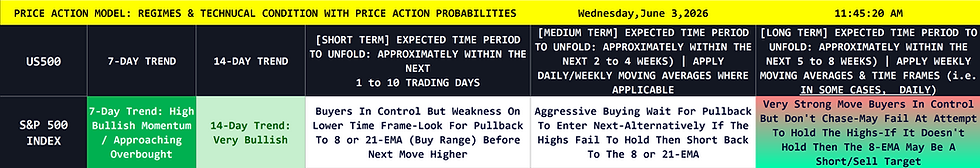
🟩 Structural Breakout 🟧 Tactical Overheating ⬆️ Buy on Pullback 🟩
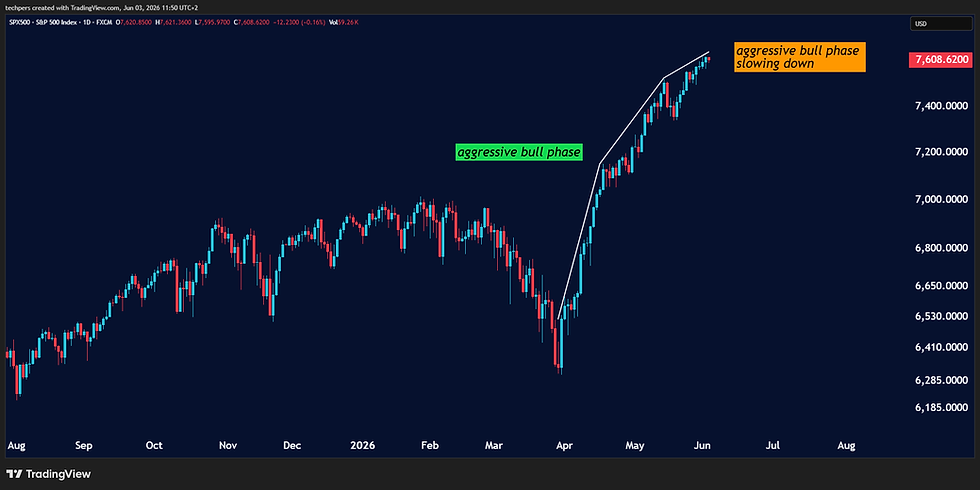
⚖️ Tactically, long positions encounter immediate friction as the daily momentum indicators reach an extended, overbought ceiling, flashing localized signs of near-term exhaustion. Conversely, short positions face severe "steamroller" risk when fading a synchronized, multi-timeframe macro breakout that is clearing key psychological thresholds. 🔭 Forecasting models indicate that near-term volatility spikes or shallow corrective flushes will seamlessly evolve into structural trend continuation, supporting a high-probability 3- to 6-month secular expansion. 📊 Driven by a powerful momentum profile where the Structural Trend and Primary Trend are fully aligned and accelerating upward, the broad-market index has broken cleanly into unmapped blue-sky discovery territory. 🌍 With strong institutional sponsorship visible across all major time horizons, the preferred strategic approach is to aggressively trail protective stops on existing longs and wait to accumulate core exposure on any tactical pullbacks toward the 7,400 structural support shelf.
Current Phase: 🟢 Blue Sky Discovery / Parabolic Expansion
Next Best-Probability Phase: 🟡 Tactical Reset / Volatility Digestion
Analyst Verdict: Trend Continuation / Hold & Trail Stops.
Tactical Risk Assessment: Integrated Confluence
Buying & Long Positions
Risk for New Buy Entries: Parabolic Climax. Initiating fresh long positions directly into a vertical, multi-day acceleration that has confidently cleared 7,500 carries severe immediate risk. With Tactical Momentum (Daily) pinned deeply in its upper bound, entering at the absolute extension leaves capital highly vulnerable to an algorithmic mean-reversion flush aimed at testing the 7,400 breakout shelf and gap-fill zone.
Risk for Existing Long Positions: Profit Erosion via Volatility. The primary macro matrix is robustly bullish, but failing to trail stops aggressively near these psychological extremes exposes unbooked premium to violent, low-liquidity shakeouts designed to reset overextended short-term indicators.
What Can Change? Continued, heavy index-heavyweight inflows forcing a clean weekly close above the 7,700 level would signal that the macro cycle is entirely overriding tactical gravity, extending the vertical squeeze.
Selling & Short Positions
Risk for New Short Entries: Steamroller Risk. Attempting to top-tick a broad-market index while the Primary Trend (Monthly) is undergoing a powerful, non-divergent vertical expansion is exceptionally dangerous. Overbought momentum profiles do not automatically function as sell signals during a blue-sky breakout; they can easily remain sustained for extended periods.
Risk for Existing Short Positions: Existential Capitulation. Caught shorts are acting as structural fuel for this upward march. Because the intermediate trend has eliminated all visible overhead supply and friction, defending short exposure here subjects capital to uncapped, vertical drawdown.
What Can Change? A high-volume distribution tail (such as an intra-day engulfing failure) that violently pushes the index back beneath the 7,400 breakout pivot would signal immediate structural exhaustion, trapping late-stage buyers and validating a deeper mean-reversion move.
Previous Post (01 May 2026):
S&P 500 Index
Bottom Line: I Was Wrong, But The Data Wasn't.
THE DATA (PRICE ACTION MODEL): Thus far, the index rebounded by nearly 14%, in line with the price action model (1 to 10 day time frame) which stated that the 'reward-to-risk had become appealing for a buy/long position.'
LESTER'S VIEW: The was out of line with my manual view i.e. it did not get down to the buy re-entry range nor did it find resistance at the sell re-entry range. My expectation was for a further decline toward the prior breakout level or a minor rally before a dip toward the next buy re-entry range.

Previous Post (Sunday, 28 March): S&P 500 Index: Waterfall Breakdown + Next Best Actionable Areas
Published on Sunday, 29 March for Monday, 30 March.


S&P 500 Index (SPX)
Momentum Profile: The weekly momentum profile reveals a catastrophic and uniform collapse. The Ultra Short Term and Short Term tiers have plunged to absolute zero-bound extremes, indicating maximum historical localized selling pressure and algorithmic capitulation. The Mid Term has dragged deep into weak territory, and the Base Term has now fractured below its neutral band into weakness, confirming that the aggressive sell-off has fundamentally damaged the longer-term macro trend.
Structural Analysis & Tactical Bias: Evaluating the 20-week macro context, the SPX was previously in a sustained, orderly structural uptrend, peaking near ~6,650. Within the 10-week window, the index printed a clear double-top distribution structure, failing to sustain new highs as institutional exhaustion set in. Looking at the 3-to-5-week timeframe, this distribution phase resolved violently to the downside. Isolating the immediate 1-week timeframe, the index printed a devastating red waterfall candle, effortlessly slicing through the 6,500 critical psychological level to close near absolute weekly lows at 6,368.85. Given the total collapse in momentum and the definitive breakdown of the macro floor, the tactical bias is strictly 🔴 Avoid / Waterfall Capitulation.
Key Support & Resistance Levels: Overhead supply and macro resistance are firmly established at ~6,500 to ~6,600, representing the massive broken support zone that now acts as a formidable ceiling containing trapped long positions. Immediate structural support is currently in a state of price discovery, but psychological and historical liquidity points to the ~6,000 to ~6,100 zone as the next viable floor. Major historical demand lies deeper at ~5,700, marking the major breakout consolidation base from late 2024.
Next Candle Probability: The current price action perfectly aligns with Scenario 99: 🔴 Waterfall Capitulation. The 1-week candle is a massive, wide-range downward expansion that completely ignored any intraday buying attempts. Because it closed at the absolute lows with virtually no lower wick, it indicates sellers maintained aggressive, panic-driven control straight into the Friday bell. The highest structural probability for the next weekly candle is continued downside follow-through, targeting lower liquidity pools as margin calls and systematic unwinds persist.
Primary View Invalidation: To invalidate this waterfall capitulation primary view, buyers must orchestrate a miraculous, high-volume V-shaped short squeeze that immediately arrests the slide and sustains a weekly close back above the ~6,500 breakdown level. This would trap the aggressive short positioning, suggest the massive flush was an anomalous liquidity sweep, and stabilize the broader macro structure.
Technical Risks & Opportunities:
3 Technical Risks:
Cascading Systemic Unwinds: A continuation below current levels risks triggering further mechanical selling from volatility-targeting funds and negative gamma options positioning, violently accelerating the markdown phase.
Momentum Entrenchment: If the Ultra Short Term and Short Term oscillators remain pinned at the zero-bound extreme without triggering a relief bounce, it signals a structural regime change where buyers have entirely abandoned the tape.
Lower High Confirmation: Any anemic, low-volume relief rally that fails to forcefully clear the 6,500 supply wall will simply provide smart money with premium liquidity to short into, cementing a macro lower-high.
3 Technical Opportunities:
Oversold Rubber-Band Snapback: The extreme downside fracturing and zero-bound momentum tiers create a highly pressurized, stretched environment; stabilization here could trigger a violent, highly tradable V-shaped relief rally.
Generational Base Reset: Should the index flush down to the 5,700 – 6,000 historical demand zone, it would wash out months of excess macro froth and provide a pristine, low-risk institutional accumulation zone for the next cycle.
Volatility Contraction Setup: If the tape can temporarily arrest the slide and begin printing tight inside bars, it sets up a defined-risk structural baseline for a mean-reversion trade once order flow balances.
The Next 10 Days: Over the next two trading weeks, the index faces a critical stabilization test as it navigates the immediate fallout of this waterfall capitulation. Given the zero-bound extremes in the faster momentum tiers, market participants should anticipate highly erratic, bidirectional volatility, where sudden, sharp short-covering relief rallies toward the ~6,500 broken support are entirely plausible but remain structurally suspect. If buyers fail to orchestrate a definitive V-shaped recovery to reclaim that 6,500 ceiling, these "dead-cat" bounces will simply provide fresh liquidity for institutional sellers, likely resulting in a secondary wave of algorithmic distribution that presses the tape down to definitively test the ~6,000 to ~6,100 historical demand zone before a durable macro floor can be established.
Forecast Projection Breakdown: With fast momentum obliterated and a clear downward expansion pattern cemented on the chart, the forward-looking probability distribution heavily favors a test of lower liquidity pools, though the extreme stretch warrants vigilance for sudden snap-backs.
The Bearish Scenario (60% Probability): The capitulation continues unabated. Sellers easily slice through minor psychological barriers, initiating a rapid markdown targeting the ~6,000 to ~6,100 liquidity pool as panic persists.
The Base/Neutral Scenario (25% Probability): The intense selling pressure temporarily exhausts itself. The index enters a choppy, highly volatile lower-range distribution phase between ~6,300 and ~6,500 as the market attempts to find an equilibrium amid shifting flows.
The Bullish Scenario (15% Probability): The extreme oversold momentum triggers a violent short-covering squeeze. Buyers aggressively absorb the supply and force a rapid upward spike back toward the ~6,500 broken floor, invalidating the immediate free-fall.
Previous Post (28 October 2025): S&P 500 Index (Monthly Chart Time Frame): Broadly Overbought Conditions


Lester Davids
Senior Investment Analyst: Unum Capital


Comments