Tencent Holdings: Important For Naspers/Prosus
- Lester Davids

- May 28
- 7 min read
Research Notes May 2026 > https://www.unum.capital/post/rmay2026
Trade Local & Global Financial Markets with Unum Capital.
To get started, email tradingdesk@unum.co.za
Analyst Disclosure: This analysis was compiled using an artificial intelligence tool, with inputs based on the analyst's own data.
STATUS OVERVIEW
TECHNICAL CONDITION: 🟥 DEEP CORRECTION / SEVERE DOWNTREND
CATEGORY: 🟥 BEARISH / MEAN-REVERSION WATCH
TREND STATUS
Daily Trend: 🟥 Steep Downtrend / Extremely Oversold
Weekly Trend: 🟥 Aggressive Distribution / Capitulation Phase
Monthly Trend: 🟥 Macro Consolidation / Bearish Momentum
Primary Action: 🟨 Wait for Base / 🟩 Trade the Relief Bounce (High Risk)
CORE THESIS: Severe Liquidation & Extreme Oversold Conditions
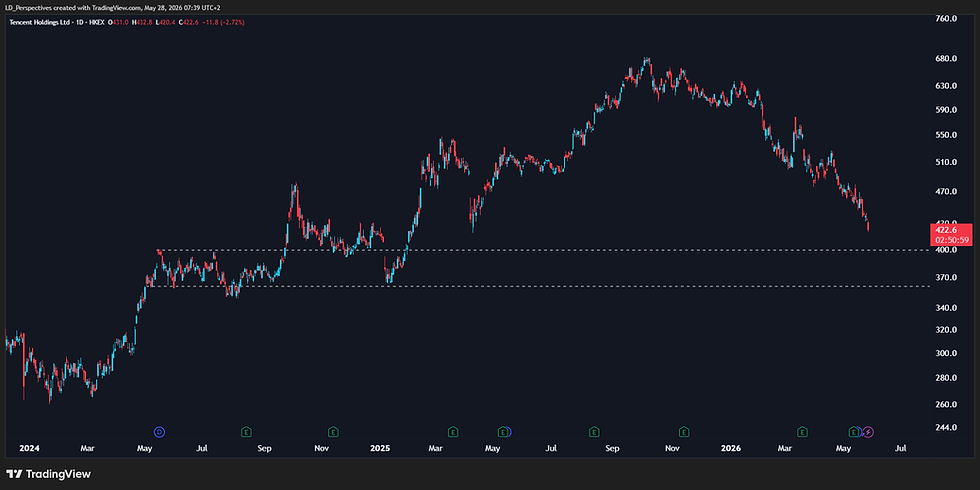
Tencent Holdings (700) is currently enduring a brutal, synchronized sell-off. Following a massive recovery rally throughout 2024 and 2025 that brought the asset back near its 2021 all-time highs (~720+ HKD), it has suffered a relentless, six-month distribution phase. The asset has shed over 40% of its value from the 2025 peak, currently trading near the 420 HKD level.
However, while the structural trend is decisively broken to the downside, the momentum profile is screaming exhaustion. With momentum at incredibly depressed levels across both daily and weekly timeframes, the selling pressure is mathematically unsustainable in the short term. The asset is likely in the final throes of capitulation. Shorting at these levels carries immense risk of a violent short-squeeze. The strategic focus must shift from trend-following to identifying a tactical mean-reversion (relief rally) setup.
Verdict: 🟨 DO NOT CATCH THE FALLING KNIFE / 🟩 WATCH FOR REVERSAL CANDLES TO PLAY A TACTICAL BOUNCE / 🟥 DO NOT INITIATE NEW SHORTS.
STRUCTURAL PROFILE (Based on Core Momentum Data)
DAILY (Tactical): Short-Term Trend ➔ 🟥 SEVERE DOWNTREND
WEEKLY (Intermediate): Structural Trend ➔ 🟥 DEEP CORRECTION
MONTHLY (Secular): Macro Cycle ➔ 🟥 BEARISH CHOP
Profile Alignment: The timeframe stack is highly destructive but universally overextended to the downside. The Monthly chart shows a volatile macro range (boom in 2021, bust in 2022, boom in 2025, bust in 2026). The Weekly chart dictates the current dominant structural move, which is a massive liquidation. The Daily chart confirms heavy, ongoing selling. The unifying theme across all three timeframes is extreme negative momentum, setting the stage for a counter-trend reaction.
STRUCTURAL TIME FRAME ANALYSIS
🟥 Daily Momentum (The Tactical Engine): The Daily chart reveals a steep "waterfall" decline since late 2025. Price action is consistently printing lower lows and lower highs with virtually no meaningful relief rallies. However, downside momentum has reached extreme limits. Such deep oversold conditions historically precede sharp, sudden, and violent relief bounces as late shorts cover and bottom-fishers step in.
🟥 Weekly Liquidation (The Structural Driver): The Weekly chart highlights the severity of the rejection from the 2025 double-top. Downside momentum is historically extreme. It is exceedingly rare for an asset of Tencent's market capitalization to maintain this level of selling pressure without triggering at least a multi-week consolidation or mean-reversion rally to reset.
🟨 Monthly Volatility (The Secular Anchor): The Monthly chart zooms out to show extreme boom-and-bust cycles. After recovering brilliantly from the late-2022 lows (~190 HKD) to peak again in 2025, it is now unwinding that entire move. At ~420 HKD, it is approaching the midpoint of its macro multi-year range, which may offer psychological and structural support.
INTERACTION VERDICT - Capitulation Watch: "You have a broken asset in a severe downtrend, but the rubber band is stretched to its absolute limit to the downside. The structural trend is your enemy right now, but the momentum extremes offer a tactical opportunity. 🟨 Patience is required. Wait for momentum divergence before attempting to buy."
CATEGORIZATION & STRATEGY
Daily Timeframe (Tactical)
Primary Category: 🟥 WATERFALL DECLINE
Impending Transition: 🟩 RELIEF RALLY / DEAD CAT BOUNCE
Strategic Overlay: 🟨 WAIT FOR BULLISH DIVERGENCE
Weekly Timeframe (Intermediate)
Primary Category: 🟥 AGGRESSIVE DISTRIBUTION
Impending Transition: 🟨 BASE BUILDING
Strategic Overlay: 🟥 AVOID CORE LONG POSITIONS UNTIL TREND REVERSES
Monthly Timeframe (Secular)
Primary Category: 🟨 MACRO CONSOLIDATION RANGE
Impending Transition: 🟥 APPROACHING RANGE SUPPORT
Strategic Overlay: 🟨 REDUCE EXPOSURE / HEDGE
STRATEGIC INTERPRETATIONS BY TIMEFRAME
🟩 TACTICAL (Next 1 to 3 Weeks): "The Daily chart is dangerously oversold. A relief rally of 10-15% is highly probable purely to reset momentum. Aggressive traders can look for a daily close that forms a reversal pattern (like a hammer or bullish engulfing) to play a quick bounce. Set extremely tight stops." Action: 🟩 Trade the Mean-Reversion (Low Size, High Alert)
🟨 INTERMEDIATE (Next 3 to 9 Months): "The Weekly chart is broken. Even if we get a tactical bounce, it will likely be sold into to form a lower high. Do not mistake a 3-week bounce for a new bull market. The asset needs months of sideways grinding to build a new base." Action: 🟨 Wait for a Weekly Base
🟨 SECULAR (Next 1 to 3 Years): "The Monthly chart shows Tencent trapped in a massive, multi-year volatile range. It is currently in the destructive phase of that cycle. Core investors should wait for the macro dust to settle closer to the 300-350 HKD level before accumulating long-term holds." Action: 🟨 Preserve Capital / Wait for Macro Support
KEY RISKS TO THESIS
🟥 The Falling Knife (Continuation Risk)
Scenario: The oversold conditions remain embedded. Instead of bouncing, the asset enters a capitulation cascade, dropping another 15-20% rapidly towards the 300 HKD level before any relief occurs.
Impact: Bottom-fishers and early buyers get crushed. Strict stop-losses are mandatory if attempting to catch the bounce.
🟧 The Dead Cat Bounce (Trap)
Scenario: The asset rallies sharply by 10-12% over a few days, convincing retail that the bottom is in. It hits declining moving averages on the Daily chart and immediately resumes the primary downtrend to make new lows.
Impact: Requires tactical traders to take profits aggressively into the first sign of strength and not overstay their welcome.
DECISION LOGIC
Current State: "Waterfall Decline & Momentum Exhaustion"
Question: Has the Daily chart printed a bullish reversal candle or momentum divergence?
🟩 Yes (Price makes a lower low, momentum makes a higher low) ➔ 🟩 EXECUTE TACTICAL BOUNCE TRADE
🟨 No, but holding steady (Price is chopping sideways) ➔ 🟨 WAIT AND MONITOR
🟥 No, price continues to plunge (Red candles closing on their lows) ➔ 🟥 STAND ASIDE. DO NOT BUY YET.
PRICE PROJECTIONS: FORWARD MODELING
🟩 BULL CASE ("Mean Reversion Rally"): Target ~500-520 HKD | Probability: 45%The extreme oversold conditions trigger a short-covering rally. Price snaps back violently to re-test the previous breakdown levels on the Daily chart. This is a counter-trend bounce, not a new bull market.
🟧 BASE CASE ("Grinding Base"): Target ~380-450 HKD | Probability: 35%The aggressive selling stops, but buyers are weak. The asset chops sideways in a volatile range for several months to slowly work off the depressed momentum and build a foundation.
🟥 BEAR CASE ("Macro Capitulation"): Target ~320 HKD | Probability: 20%The 400 HKD psychological level breaks with volume. Panic selling ensues, driving the asset down to test the upper bounds of the 2022 macro crash levels before finding structural support.
SCENARIO PLANNING
🟩 Trading the Bounce: If executing a mean-reversion trade, use the recent swing low as a hard stop. Your target should be the first major declining moving average (e.g., the 20-day or 50-day EMA). Take profits quickly.
🟥 Respecting the Structural Trend: Remember that the higher timeframes (Weekly, Monthly) are pointing straight down. Any long position right now is swimming against a very strong current.
EXECUTION PROTOCOL
PRIMARY: 🟨 Stand aside for long-term holds, 🟩 Trade tactical bounces with tight risk management.
🟥 Step 1: Do not initiate any new short positions. The risk-to-reward ratio is terrible down here due to the threat of a short-squeeze.
🟨 Step 2: For tactical longs, wait for daily momentum to tick upward accompanied by a green, high-volume reversal candle.
🟩 Step 3: If triggered, size down. Only risk a fraction of standard capital on counter-trend trades. Set hard stops strictly below the capitulation wick.
CONCLUSION
Tencent Holdings (700) is currently technically broken but severely overextended. The asset has been heavily distributed over the last six months, resulting in exceptionally rare oversold momentum readings on the Daily and Weekly charts. While the structural trend remains hostile and warns against buying for long-term holds, the short-term rubber band is stretched to the point where a sharp, tactical relief rally is highly probable. 🟨 Investors should exercise extreme caution, avoiding the temptation to catch the falling knife, while tactical traders can prepare to capitalize on an imminent mean-reversion bounce.
READY TO TRADE: ACTIONABLE AREAS
For active traders who look to generate cash flow on a continuous basis, determining the ‘next best probability’ level to execute against may be of immense value, specifically by helping to determine the best potential times and levels to commit capital.
The blue and red horizontal lines on the chart represent a next-best-probability buy re-entry range and a next-best-probability sell re-entry range over the short term. The ranges assume no existing position is being held by a trader, while the probabilities are based on several factors, which may include:
Short-term ratings and medium-term regimes
Momentum indicators
Horizontal or diagonal support and resistance
Candle structure
Moving averages and standard deviation
Please note that these are short-term levels and may contrast with medium- and long-term outlooks, which are based on the weekly and monthly charts and are generally more applicable to long-term investors. These levels are subject to change based on market sentiment, subsequent price action, and company/sector-specific or macroeconomic news flow. As always, while the levels are outlined to guide your capital deployment, traders should be prepared to adjust in real-time based on the aforementioned factors.
THE TACTICAL TRADING GUIDE (PRICE ACTION MODEL): UNCOVER OPPORTUNITIES & ASSESS REWARD-TO-RISK
It helps helps clients determine and shed light on the some of the following:
The CURRENT TECHNICAL POSITION and a PRICE ACTION PROBABILITY for multiple time frames.
Three (3) ‘trading’ time frames are considered: Short Term (1 to 10 days) / Medium Term (2 to 4 weeks) and Long Term (5 to 8 weeks)
Whether the reward-to-risk is attractive for a buy/long position
Whether a share is weak. In this case, wait until the price stabilizes before looking to enter (i.e. want until it stops going down)
Whether aggressive buying is underway. In this case, do not ‘chase’ (do not buy) but instead wait for a pullback to re-enter a buy or an overextension with deteriorating candle structure to sell/short.
Whether a trader can look to buy a pullback into a key moving average (continuation trade)
Whether a share needs to break a range for a new trend to be determined (bullish or bearish)
Whether a traders needs to monitor for a change of character that could lead to a bullish or bearish reversal
Whether a share could start a consolidation phase or before continuing it’s bullish or bearish trend
Whether the upward momentum is slowing (if it's in a bullish phase)
Whether buyers can look to 'phase in' to a position (if it's in a bearish phase)
Whether a share lacks directional bias.
The data set is available in real-time (on request)
The readings are subject to change as the price action develops.
Lester Davids
Senior Investment Analyst: Unum Capital


Comments