TFG: Price Action Model Readings🟥Short Term Risks🟩Medium Term Reward + Relative Distance Data Point
- Lester Davids

- May 12
- 2 min read
Research Notes May 2026 > https://www.unum.capital/post/rmay2026
Trade Local & Global Financial Markets with Unum Capital.
To get started, email tradingdesk@unum.co.za
Are you garnering insights from our research but executing your trades elsewhere? Switch to Unum Capital today.

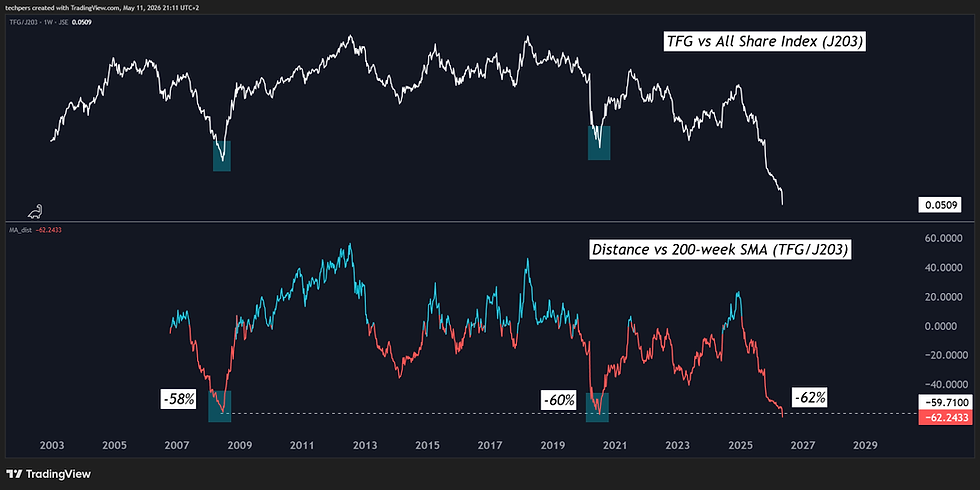
Foschini relative to the JSE All Share Index. For now, both the sector & stock remain under serious pressure. A data point from a mean reversion perspective (relative distance chart). TFG is trading 62% below it's 200-week relative to the JSE All Share Index. Note the prior years' extension & snapback. Possibly more downside but a chart worth noting.
Please Note: This research/analysis may NOT reflect the entire view on the instrument discussed. Other technical valuation models may include: Momentum Analysis, the Price Action Model, Momentum Matrix, Slope Analysis & Relative Analysis among others.
THE TACTICAL TRADING GUIDE (PRICE ACTION MODEL): UNCOVER OPPORTUNITIES & ASSESS REWARD-TO-RISK
It helps helps clients determine and shed light on the some of the following:
The CURRENT TECHNICAL POSITION and a PRICE ACTION PROBABILITY for multiple time frames.
Three (3) ‘trading’ time frames are considered: Short Term (1 to 10 days) / Medium Term (2 to 4 weeks) and Long Term (5 to 8 weeks)
Whether the reward-to-risk is attractive for a buy/long position
Whether a share is weak. In this case, wait until the price stabilizes before looking to enter (i.e. want until it stops going down)
Whether aggressive buying is underway. In this case, do not ‘chase’ (do not buy) but instead wait for a pullback to re-enter a buy or an overextension with deteriorating candle structure to sell/short.
Whether a trader can look to buy a pullback into a key moving average (continuation trade)
Whether a share needs to break a range for a new trend to be determined (bullish or bearish)
Whether a traders needs to monitor for a change of character that could lead to a bullish or bearish reversal
Whether a share could start a consolidation phase or before continuing it’s bullish or bearish trend
Whether the upward momentum is slowing (if it's in a bullish phase)
Whether buyers can look to 'phase in' to a position (if it's in a bearish phase)
Whether a share lacks directional bias.
The data set is available in real-time (on request)
The readings are subject to change as the price action develops.
Lester Davids
Senior Investment Analyst: Unum Capital


Comments