This Monthly Candle Has Caught My Attention
- Lester Davids

- Oct 1, 2024
- 1 min read
Tuesday, 01 October 2024
Time Published: 06h53
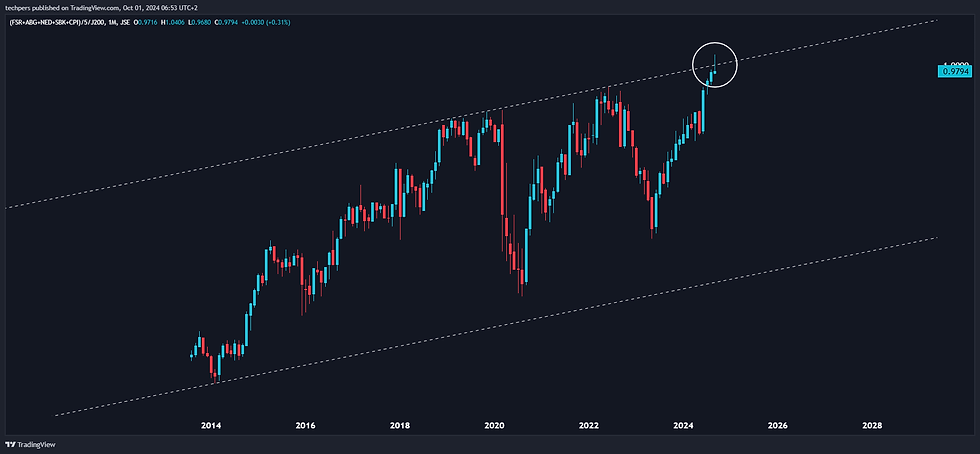
An Update: JSE Banks vs JSE Top 40 Index
The closing candle on the ratio chart highlights the current sector rotation.
A long upper tail within a medium term overbought range + at channel resistance
Interpretation: Selling Pressure Following An Attempt To Rally
Scroll down for previous commentary
Previous Post: Thursday, 12 September 2024 (JSE Banks vs JSE Top 40: Approaching Key Inflection Point)
Real-Time: 11h24
Approaching channel resistance
Extended vs 75-week EMA

Previous Post (26 July)
Pre-Market
The Most Overbought In (Nearly) 3 Years
This is a ratio chart which shows the banks (equally weighted) relative to the JSE Top 40 Index.
The ratio has just entered an overbought range, which means that it can remain so over the short term, however, the rating (overbought) also means that the relative buy/long reward-to-risk (from a sector allocation weighting perspective) is unappealing.

Lester Davids
Analyst: Unum Capital


Comments