
S&P 500 Index

Research: October 2026 > https://www.unum.capital/post/roct2026
For our clients trading the S&P 500 Index.
Disclosure: The commentary below was compiled using an artificial intelligence tool, based on my own data.
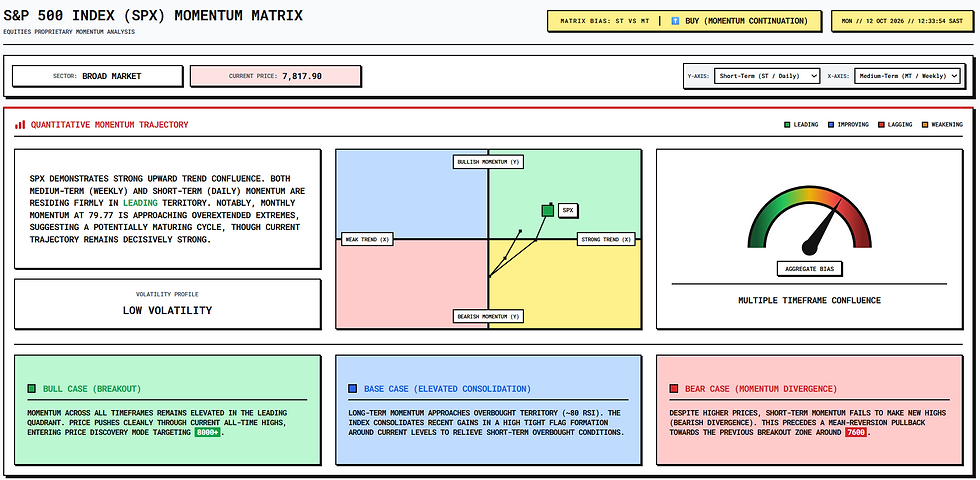
As of October 12, 2026, the US 500 Index is trading at 7,819.90, up +0.06% for the session. The primary uptrend remains exceptionally strong, with price action hovering near record territory and riding above an expansive, sequentially ascending moving average ribbon ⬆️. Our overall trend score sits at 88 out of 100, reflecting dominant institutional accumulation, robust relative strength, and an intact secular baseline.
Looking at the Probability Assessment, multiple timeframes reflect clear structural dominance. The Monthly (Secular Cycle) outlook indicates a macro bull market expansion, holding an 90% bullish probability ⬆️. The Weekly (Structural Trend) view confirms an entrenched uptrend holding firmly above all trailing weekly supports, carrying an 85% bullish probability ⬆️. The Daily (Tactical Momentum) timeframe sits at 75% ⬆️, reflecting steady continuation and shallow digestion near multi-week highs.
This structural leadership is confirmed by the Moving Average Slopes. On the daily chart, price remains elevated comfortably above the dynamic ribbon. The tactical 8-Day EMA (7,780.18) and momentum 21-Day EMA (7,735.43) are both positively sloped and tracking directly beneath current price action, serving as immediate dynamic support ⬆️. Below them, the structural 75-Day SMA (7,620.47) continues to advance higher ⬆️. On the weekly timeframe, the fast weekly 8-Week EMA (7,734.71), 21-Week EMA (7,576.30), and 50-Week SMA (7,223.28) are all stacked in classic bullish sequence and sloping steadily upward ⬆️. Overall price slope dynamics confirm a secular bull trend ⬆️ supported by active short-to-medium-term momentum ⬆️.
The Candle Structure Profile highlights steady distribution-free absorption at
elevated levels. The 1-Day structure shows a tight consolidation candle (+0.06%) pressing against local highs (7,839.60) while holding above the 8-EMA. Looking at the 3-to-5-day profile, we see a constructive re-test and breakout from the late-September consolidation range. The 10-to-20-day profile reflects a series of higher swing lows off the 7,650–7,700 level, underscoring institutional demand on shallow pullbacks.
Actionable Perspectives & Key Levels
From a Mean Reversion standpoint, price is tracking near the upper edge of its tactical envelope; the actionable view is to Trail Stops / Hold Core Exposure 🟩⬆️. From a Momentum perspective, the alignment across daily and weekly moving averages supports a Buy on Pullbacks to Tactical EMAs 🟩⬆️ approach.
Key price boundaries dictating the current structure:
Tactical Resistance / Session High: 7,839.60 🔴
Psychological Extension Target: 8,000.00 🔵
Tactical Dynamic Support (8-Day EMA): 7,780.18 🟢
Momentum Cushion (21-Day EMA / 8-Week EMA): 7,735.43 – 7,734.71 🟢
Structural Support Level (75-Day SMA): 7,620.47 🟢
Medium-Term Baseline (50-Week SMA): 7,223.28 🟢
Risks To Entering Buy/Long Positions At Current Levels:
Proximity to Round-Number Psychological Resistance: Price is pressing into unchartered highs ahead of the major 8,000.00 milestone, where systematic rebalancing and profit-taking could trigger localized overhead supply.
Compression Near Range Highs: Initiating breakout longs at the upper boundary without waiting for a shallow retest of the 8-Day EMA (7,780.18) risks short-term drawdown if intraday momentum stalls.
Macro Extension from Primary Moving Averages: Price remains materially extended above the weekly 50-Week SMA (7,223.28), leaving late-stage trend followers vulnerable to eventual multi-week mean-reversion drawdowns.
Risks To Entering Sell/Short Positions At Current Levels:
Opposing Aligned Trend Stacks: Shorting against sequentially ascending daily (8-Day, 21-Day, 75-Day) and weekly (8-Week, 21-Week, 50-Week) moving averages carries a high probability of trend continuation failure.
Aggressive Absorption on Dips: Pullbacks over the preceding several months have consistently been shallow and quickly reclaimed, creating persistent short-squeeze risks.
Absence of Structural Reversal Patterns: The price chart exhibits no confirmed double tops, lower swing highs, or momentum breakdowns below tactical support bands to justify counter-trend positioning.


Comments