
Trading Spot Gold: Updated Outlook, Risks & Probabilities

Research Notes May 2026 > https://www.unum.capital/post/rmay2026
Trade Local & Global Financial Markets with Unum Capital.
To get started, email tradingdesk@unum.co.za
Analyst: Disclosure: The commentary below was generated using an artificial intelligence tool, based on the analyst's own data.
🟩 Structural Bull
🟥 Tactical Correction
↔️ Wait for base
Gold is executing a deep, high-velocity strategic correction within its broader secular bull market. While the Monthly timeframe remains firmly anchored in the Strong tier—confirming the primary multi-year compounding trend is structurally intact—the faster execution timeframes have sustained significant technical damage following the rejection at recent historical highs. Both the Strategic (Weekly) and Tactical (Daily) timeframes have sliced below their respective Neutral baselines and are currently entrenched in Weak territory. This multi-frame misalignment indicates that sellers are actively controlling the near-term tape, systematically clearing out over-leveraged late-stage momentum participants. Because the underlying macro resume remains highly bullish but the tactical falling knife has not yet found a quantitative equilibrium, the system triggers a ↔️ Wait for base signal. Deploying fresh capital into this immediate downward velocity carries poor reward-to-risk asymmetry; patience is required to allow the daily momentum to either strike terminal oversold extremes or establish a verified lateral floor.
MOMENTUM PROFILE
Daily Chart (Tactical): Mid Term Momentum is 🟥 WEAK. The daily pulse is trending firmly in the lower bounds, actively validating the current sequence of lower highs and lower lows. Immediate distribution pressure is dominant, though the "Rubber Band" is steadily approaching oversold acceleration bands where a sharp, mean-reverting bounce becomes mathematically probable.
Weekly Chart (Strategic): Mid Term Momentum is 🟥 WEAK. The strategic timeframe has decisively broken the neutral band, confirming this is more than just a brief intraday flush; it is a genuine swing-level reset. This confirms that significant overhead supply now exists, which will likely cap and suppress initial relief rallies.
Monthly Chart (Macro): Mid Term Momentum is 🟩 STRONG. The secular engine remains the primary anchor. Despite the near-term violence, macro momentum is comfortably sustaining its structural bullish regime, providing a high-conviction underlying tailwind that should eventually arrest the current markdown and serve as the launchpad for the next cyclical leg higher.

STRUCTURAL BREAKDOWN & VELOCITY
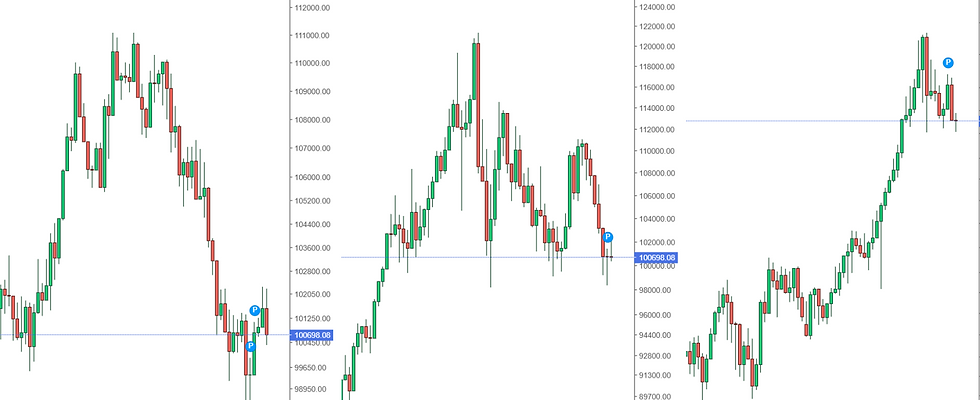
1-Day Structure (Markdown Phase): The daily chart displays a distinct corrective channel with a steep negative slope. Price action is actively probing lower support clusters, seeking an institutional liquidity floor after surrendering significant premium from the peak.
Weekly Structure (Trend Pullback): The weekly view confirms a sharp, multi-week retracement. The intermediate trajectory has shifted aggressively downward as the asset digests the massive preceding markup phase, structurally resetting the broader chart.
Monthly Structure (Secular Core): The multi-year lens highlights XAUUSD as a premier secular asset. The current move, while tactically severe, is mathematically a healthy and necessary mid-cycle correction that is simply returning to test the broader structural support baselines.
CONTRARIAN ASYMMETRY & SUPPORT MAPPING
🟥 Distribution Zone (Tactical Short/Reduce): $4,900 – $5,100. The immediate overhead supply block created during the recent top. Tactical relief rallies into this zone offer high-probability opportunities to trim exposure, as the damaged daily and weekly engines will likely face immediate exhaustion upon a retest.
🔴 Immediate Tactical Support (Fragile Floor): $4,450 – $4,550. The current active zone being probed for liquidity. It may provide brief intraday friction, but lacks the robust historical volume-at-price confirmation required to be classified as a high-conviction "Value Floor".
🟩 Secondary Support Shelf (The Value Floor): $4,100 – $4,250. The primary structural base where previous major accumulation occurred. This is the optimal, mathematically sound destination to target for scaling into deep structural long positioning.
🔵 Primary Macro Support (The Secular Floor): $3,200 – $3,500. The ultimate defensive boundary protecting the massive multi-year breakout.
TECHNICAL VALUATION & VARIANCE MATRIX
Estimated Technical Fair Value (TFV): $4,750. Calculated as the volume-weighted equilibrium point of the previous structural consolidation ledge before the final euphoric blow-off top.
Current Price Discount: The asset currently trades at a rough -4.44% discount relative to its near-term TFV, confirming it is tactically stretched to the downside while remaining within a broader macro uptrend.
Tactical Upside Potential: +4.64% to the primary mean-reversion TFV target ($4,750) from current levels if a sharp counter-trend stabilization occurs.
Tactical Downside Risk: -7.46% risk to the high-conviction secondary structural support shelf ($4,200).
Asymmetry Ratio: At current levels, the mathematical edge lies in capital preservation. Fighting the immediate tactical trend carries unnecessary risk until the daily momentum metrics decouple from price or hook decisively out of the lower bounds.
TACTICAL PROBABILITY PROFILE
🟨 LONG: Immediate Market Entry | 25% (Catching a falling knife)
🟥 SHORT: Rejection on relief rally to $4,750 | 65% (Trend continuation fade)
🟢 LONG: Confirmed Tactical Base / Momentum Hook | 75% (Waiting for stabilization)
🔵 LONG: At $4,200 Macro Base | 90% (High-conviction structural entry)
CORE THESIS
XAUUSD is navigating a textbook strategic reset. The divergence between the intact, Strong macro baseline and the highly compromised tactical/strategic engines creates a classic "wait and see" setup. The underlying trend is your friend, but the immediate entry timing is mathematically hostile. The optimal strategy requires standing completely aside, utilizing the current downward velocity to allow the asset to seek out the $4,200 structural accumulation zone, or waiting for the daily momentum engine to carve out a definitive bullish divergence against the current downtrend.
WHAT CAN CHANGE?
🟦 Bullish Momentum Divergence: If price continues to flush toward $4,400 but the tactical momentum tier establishes a higher low and hooks upward, it would signal the earliest quantitative exhaustion of selling pressure, setting up a high-probability mean-reversion buy.
🟨 Dead-Cat Bounce: An impulsive daily spike that partially retraces the drop toward $4,750, only to immediately fail at a declining short-term moving average, dragging momentum back down and confirming the correction is incomplete.
🟥 Macro Breakdown Validation: A weekly close slicing cleanly and decisively below the $4,100 support shelf would invalidate the "Healthy Correction" thesis, indicating a fundamental regime shift and a deeper unwinding of the primary bull cycle.
Lester Davids
Senior Investment Analyst: Unum Capital


Comments