
Spot Gold

Research: October 2026 > https://www.unum.capital/post/roct2026
Disclosure: The commentary below was compiled using an artificial intelligence tool, based on my own inputs/data.

As of October 14, 2026, Spot Gold is trading at 4,155.0360, down -0.15% for the session. The asset remains locked in an extended multi-month consolidation regime beneath its primary moving average ribbon, with price action currently testing tactical dynamic resistance following a modest bounce from the 4,000.00 psychological shelf 🔄. Our overall trend score sits at 45 out of 100, reflecting neutral-to-defensive relative strength, heavy overhead moving average compression, and an unconfirmed structural recovery.
Looking at the Probability Assessment, secular resilience continues to contrast with medium-term structural headwinds. The Monthly (Secular Cycle) outlook maintains a broad macro bull market backdrop, holding a 70% bullish probability ⬆️. The Weekly (Structural Trend) view reflects an unresolved intermediate correction, holding a 40% bullish probability ↕️. The Daily (Tactical Momentum) timeframe sits at 45% ↕️, capturing a compressed, range-bound regime as price struggles to break free from tight moving average clusters.
This transitional backdrop is evident across the Moving Average Slopes. On the daily chart, price is pressing directly into the short-term ribbon. The tactical 8-Day EMA (4,164.0690) and momentum 21-Day EMA (4,210.6736) are sloping modestly lower and capping immediate upside ⬇️. Overhead, the structural 75-Day SMA (4,289.9132) and primary 200-Day SMA (4,522.1839) are both negatively sloped or flattening, serving as dense structural ceilings ⬇️. On the weekly timeframe, the fast weekly 8-Week EMA (4,249.7601) and 21-Week EMA (4,313.4096) are trending downward, while the 50-Week SMA (4,251.7971) acts as intermediate resistance ⬇️. Deep foundational support remains defined by the ascending secular 200-Week SMA (2,988.9501) ⬆️. Overall price slope dynamics confirm an intermediate consolidation/corrective phase 🔄 within an overarching secular trend ⬆️.
The Candle Structure Profile highlights low-volatility compression and localized indecision. The 1-Day candle shows narrow intraday movement (-0.15%), pressing just underneath the 8-EMA. Looking at the 3-to-5-day profile, we see a tight range-bound crawl between 4,140.00 and 4,170.00, reflecting equilibrium between tactical dip-buyers and overhead sellers. The 10-to-20-day profile shows a gradual higher-low base forming off the late-September retest near 4,000.00, though without decisive expansion candles to signal trend continuation.
Actionable Perspectives & Key Levels From a Mean Reversion standpoint, price is pinned within a congested moving average pocket; the actionable view is to Await Range Resolution / Monitor 4,164–4,210 Dynamic Ceiling 🟨🔄. From a Momentum perspective, because price trades below all intermediate EMAs and the 200-Day SMA, the actionable view is to Fade Rallies into Structural Resistance / Await Reclaim of 4,290 🟥⬇️.
Key price boundaries dictating the current structure:
Primary Overhead Trendline (200-Day SMA): 4,522.1839 🔴
Structural Supply Shelf (21-Week EMA): 4,313.4096 🔴
Intermediate Dynamic Resistance (75-Day SMA): 4,289.9132 🔴
Weekly Structural Resistance (50-Week SMA): 4,251.7971 🔴
Weekly Tactical Resistance (8-Week EMA): 4,249.7601 🔴
Momentum Ceiling (21-Day EMA): 4,210.6736 🔴
Tactical Dynamic Hurdle (8-Day EMA): 4,164.0690 🔴
Current Price: 4,155.0360 ⚪
Tactical Support Shelf (Recent Swing Lows): 4,000.00 – 4,050.00 🟢
Secular Cycle Floor (200-Week SMA): 2,988.9501 🟢
Risks To Entering Buy/Long Positions At Current Levels:
Stacked Overhead Moving Average Cascade: Price faces immediate overhead compression from the 8-Day EMA (4,164.07), 21-Day EMA (4,210.67), and the tightly bunched weekly moving averages (4,249–4,313), creating multiple high-probability zones for supply absorption.
Trading Below Primary Trendline: Price remains well below the downward-sloping 200-Day SMA (4,522.18), meaning long exposure operates counter to the prevailing intermediate trend structure.
Risk of Breakdown Below Major Psychological Base: A failure to sustain price action above the 4,000.00–4,050.00 demand floor could trigger aggressive stop runs, opening downside risk toward deeper weekly support bands.
Risks To Entering Sell/Short Positions At Current Levels:
Proximity to Major Multi-Month Support: Shorting at current levels (4,155.04) places positions directly above a proven demand shelf around 4,000.00, offering poor asymmetric risk-to-reward.
Short Squeeze on Compression Breakout: Tight multi-day volatility compression can lead to sudden, violent directional expansion; a strong push through the 8-Day EMA could force rapid short covering toward the 21-Day and 75-Day moving averages.
Secular Macro Bull Trend Alignment: Spot gold's long-term macro uptrend remains supported by the deeply anchored 200-Week SMA (2,988.95), meaning extended short positions face broader structural tailwinds.
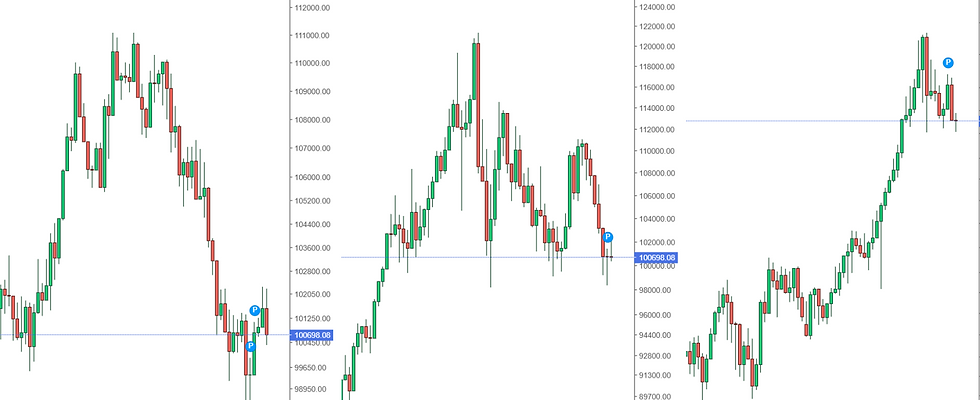
Gold: Daily, Weekly & Monthly Chart


Comments