Trading Spot Gold: Outlook, Risks & Probabilities
- Lester Davids

- Jun 23
- 3 min read
Take Profit Opportunities: Our Capabilities > https://www.unum.capital/post/capabilities
Free Content: June 2026 > https://www.unum.capital/post/rjune2026
Trade Local & Global Financial Markets with Unum Capital.
To get started, email tradingdesk@unum.co.za
Analyst: Disclosure: The commentary below was generated using an artificial intelligence tool, based on the analyst's own inputs/data.
Core Thesis
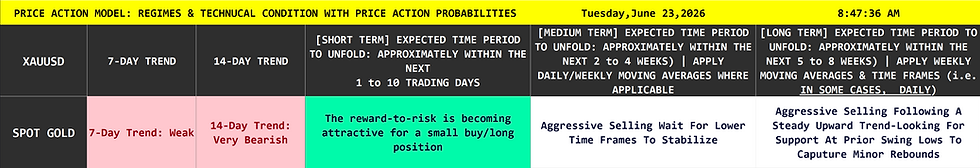
Spot Gold is experiencing a violent momentum reset. The current alignment of bearish indicators suggests that the market is prioritizing liquidity, with sellers dominating the tactical landscape. The core strategy is to exercise patience; the quantitative edge is found in observing how the price interacts with the 4,000.00 structural pivot, rather than attempting to catch the falling knife in the current high-velocity flush.
🟥 Structural correction 🟥 Tactical capitulation 🔎 Pullback observation 🟩
Buy/Long reward-to-risk: 🟢 Appealing
Sell/short reward-to-risk: 🟧 Unappealing
Current phase: 🔴 High-velocity markdown / capitulation
Next best-probability phase: 🟡 Tactical mean-reversion / volatility stabilization
Analyst verdict: ➡️ Awaiting structural floor confirmation / preserve capital
Spot Gold [4119.53] is currently undergoing a sharp, high-velocity tactical flush. The asset is exhibiting aggressive markdown characteristics across all primary timeframes as momentum engines experience a synchronized descent from overextended levels. Because the Tactical (Daily), Strategic (Weekly), and Secular (Monthly) momentum indicators are all trending lower—with the Daily and Weekly engines plunging into WEAK to HIGH BEARISH MOMENTUM / APPROACHING OVERSOLD territory—the current price action reflects a period of intense liquidity withdrawal. The asset has entered a 🔎 Pullback Observation phase, identifying this as a high-volatility window where market participants are observing whether structural floors can successfully arrest the current capitulation velocity.
Momentum Profile
Daily Chart (Tactical): Mid Term Momentum is WEAK at 32.27. The daily engine is rapidly approaching the HIGH BEARISH MOMENTUM / APPROACHING OVERSOLD threshold, confirming dominant selling pressure and a high probability of a mean-reverting bounce.
Weekly Chart (Strategic): Mid Term Momentum is HIGH BEARISH MOMENTUM / APPROACHING OVERSOLD at 23.35. This level has collapsed into the deeper momentum tiers, validating the intensity of the current drawdown.
Monthly Chart (Macro): Mid Term Momentum is NEUTRAL at 48.13. The secular engine has mean-reverted to the neutral baseline, indicating that the long-term trend is currently stabilizing after a period of extreme expansion.
Structural Breakdown & Velocity
1-Day Structure (Vertical Markdown): The daily chart reflects a sharp, impulse-driven decline, breaking through intermediate support levels with high conviction.
Weekly Structure (Trend Inversion): The weekly perspective shows a significant structural shift as the asset retests long-term trend baselines following the recent parabolic top.
Monthly Structure (Secular Core): Despite the current tactical weakness, the monthly view confirms the asset remains within a dominant multi-year uptrend structure, currently testing a major re-entry pivot.
Contrarian Asymmetry & Support Mapping
Primary Upside Target (The Reward): 4,500.00 – 4,800.00. This zone identifies the primary overhead supply block where previous distribution occurred.
Structural Risk Pivot (The Invalidation Point): 3,800.00 – 4,000.00. The critical structural floor. A sustained breach below this level would signal a more protracted corrective regime.
Asymmetry Observation: The interaction between the current price and the 4,000.00 structural pivot presents a high-variance environment; market participants are assessing whether this level acts as a floor for a new markup cycle or a trigger for further structural breakdown.
Technical Valuation & Variance Matrix
Estimated Technical Fair Value (TFV): 4,050.00. The calculated equilibrium point where recent volume-at-price clusters have formed.
Current Price Variance: The asset is currently trading at a marginal premium to its near-term TFV, signaling that tactical sellers are still in control of price discovery.
Asymmetry Ratio: The current setup offers a speculative risk-reward variance, contingent on the asset’s ability to defend the 4,000.00 structural baseline.
Tactical Probability Profile
Long: Immediate Market Entry | 20% (Risk of continued capitulation)
Long: At 3,950.00 Structural Pivot | 75% (Optimal contrarian re-engagement)
Long: At 3,600.00 Macro Base | 90% (High-conviction structural entry)
What Can Change?
Bullish Resumption: A daily close reclaiming 4,400.00 would signal the end of the capitulation phase and suggest that structural buyers are re-entering the market.
Momentum Divergence: A new price low accompanied by a rising RSI would suggest that the current selling velocity is exhausted, likely preceding a mean-reverting rally.
Macro Failure: A weekly close decisively below 3,800.00 would invalidate the secular bullish thesis and signal a broader, more severe structural correction.

Lester Davids
Senior Investment Analyst: Unum Capital


Comments