
Spot Gold

Disclosure: The analysis below was compiled using an artificial intelligence tool.
Current Price: $4,195.400
Date & Time: September 30, 2026, 09:39 UTC+2
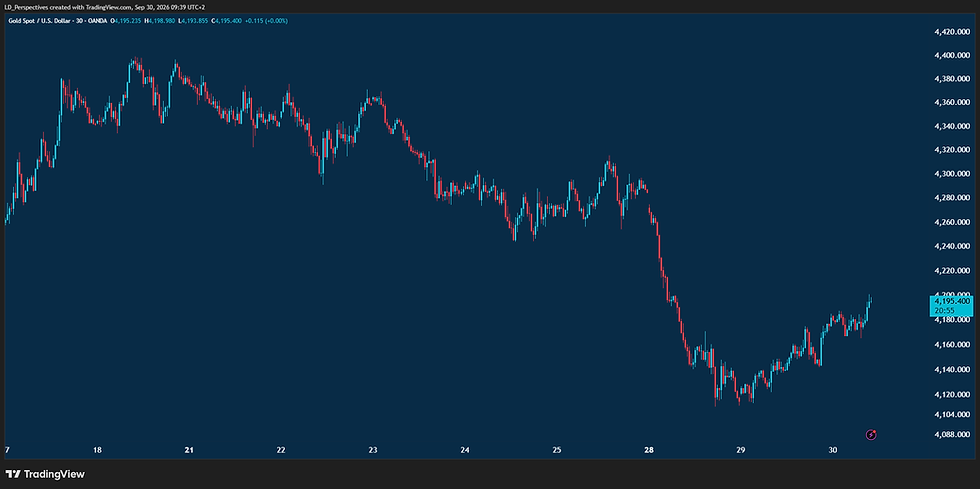
Currently, price action for Spot Gold is probing the critical 4,200.00 psychological barrier, trading near 4,195.40 after printing an intraday high of 4,198.98. Initiative buyers have extended a sustained, multi-session recovery impulse, driving the active 30-minute candle higher with expanding bullish range. While short-term momentum remains firmly upward, price is now directly engaging the underside of the major liquidation shelf from late September, where overhead supply is expected to challenge further directional expansion.
Looking at the broader macro structure, this rally represents a major counter-trend retracement within the dominant intermediate downtrend that originated from the 4,400+ highs on September 21. Having now recovered nearly 90 dollars from the 4,110 capitulation low, the pair is entering a critical test of overhead polarity. The 4,200.00 – 4,220.00 zone marks the origin of the late-September breakdown, meaning the market is transitioning from an easy recovery vacuum into dense structural resistance.
Tactical Action: At/approaching sell/reduce 🟥
4-Hour Forecast
Price is expected to encounter significant friction and range compression within the 4,195.00 – 4,205.00 zone as aggressive buying momentum collides with psychological resistance and profit-taking. A failure to achieve consecutive 30-minute closes above 4,202.00 is likely to induce a shallow corrective pullback toward the 4,175.00 – 4,182.00 retest shelf. As long as that shelf holds on a closing basis, the short-term structure remains constructive for continued range testing.
8-Hour Forecast
Over the 8-hour horizon, the market faces a pivotal decision between absorption and overhead supply rejection. If buyers successfully defend the 4,170.00 – 4,175.00 base during an interim retracement, another attempt to break through 4,205.00 becomes probable, potentially targeting an extension toward 4,220.00. Conversely, a break and 30-minute acceptance below 4,168.00 would confirm local exhaustion, signaling that this multi-day counter-trend bounce has run its course and initiating a deeper slide toward 4,145.00 – 4,150.00.
24-Hour Forecast
Across the full daily cycle, the dominant technical theme is whether this recovery can challenge the primary breakdown ceiling at 4,240.00 – 4,255.00. A sustained breakout and daily hold above 4,220.00 would neutralize the broader intermediate downtrend, shifting the market into a wider neutral consolidation regime. However, if overhead sellers reassert control anywhere within the 4,200.00 – 4,220.00 block, expect the broader markdown sequence to resume, rotating price back downward toward the 4,130.00 – 4,140.00 value area.
Spot Gold 30-Minute Chart
Trailing Candle Structure Analysis
Trailing 5-Period Structure (Impulse Expansion into Highs):
Characterized by an aggressive green expansion candle breaking out from the 4,178.00 shelf to test 4,198.98.
Demonstrates decisive short-term buyer initiative and the triggering of trailing short stops ahead of the 4,200 round number.
Trailing 10-Period Structure (Consolidation & Launch Platform):
Displays tight lateral coiling between 4,170.00 and 4,185.00 with contracting body spreads.
Confirms the absorption of early profit-taking and the establishment of a defined intraday support floor.
Trailing 20-Period Structure (Ascending Trend Progression):
Captures the entire staircase recovery originating from the 4,140.00 shelf.
Reflects an orderly series of higher highs and higher lows, illustrating sustained responsive control through the European morning.
Risks of Entering a Buy/Long Position at Current Levels
Buying Directly into Formidable Psychological Resistance: Price is trading immediately beneath the 4,200.00 handle, where heavy limit order supply and early take-profit activity are concentrated.
Overextended Short-Term Velocity: Entering at the crest of an impulse expansion after an unbroken 85-dollar ascent from 4,110 exposes longs to immediate adverse excursion from routine mean-reversion retests.
Asymmetric Risk/Reward: With immediate supply capping upside between 4,200.00 and 4,210.00, logical stop placement below the 4,170.00 consolidation shelf yields a poor risk-to-reward ratio.
Risks of Entering a Sell/Short Position at Current Levels
Fighting Strong Momentum Initiative: The active bar shows aggressive buying pressure with expanding volume and no confirmed rejection wick or bearish divergence yet on the 30-minute timeframe.
Squeeze Risk Above 4,200: A clean breakout and 30-minute close above 4,205.00 could trigger cascading stop runs from higher-timeframe shorts, sparking a swift squeeze straight into 4,220.00.
Absence of a Reversal Trigger: Prematurely fading the move before price prints an explicit topping formation (such as a shooting star or bearish engulfing candle) risks severe slippage against momentum continuation.
Lester Davids
Senior Investment Analyst: Unum Capital


Comments