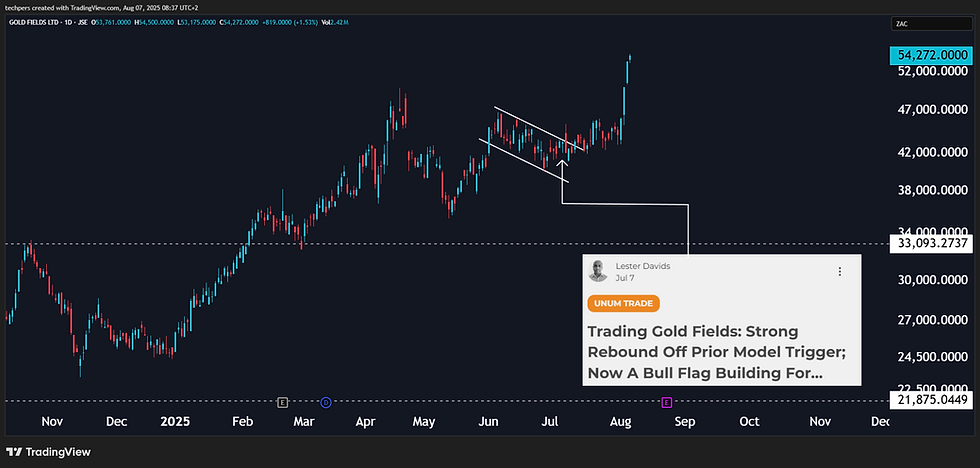
Gold Fields: Running +26% & Advancing Over 11200c From The Bull Flag Structure (Reduce Into Strength)
- Lester Davids

- Aug 7, 2025
- 1 min read
Research Notes 04 - 08 August > https://www.unum.capital/post/r0408august
Trade Local & Global Financial Markets with Unum Capital.
To get started, email tradingdesk@unum.co.za
Previous Post (Monday 04 August): Gold Fields: Now Trading Higher by +2700c (High of +R460) & Potential For Bullish Follow-Through


Previous Post (07 July): The share rebounded from ~R370 to +R460, based on the model reading (scroll down) for previous post. Now, a potential bull flag with the potential for upside continuation.

Previous Post: We had 4 days to build a position
This is another example of how traders can use the data to capitalize on opportunities. We have been very consistent in re-publishing the Tactical Trading Guide (price action model) at the end of each day. Here, clients are able to obtain a reading for more than 60 shares for 3 time frames. At the end of day on Monday 12 May, the reading for Gold Fields was as follows: 'The share has recently been sold off. Expect a small rebound'.
The time-stamped reading and updated chart is shown below:


Previous Post (Monday, 12 May)
Trade JSE Shares with Unum Capital.
To get started, email tradingdesk@unum.co.za
Click on the image to enlarge.
Readings as of the close of trade on Monday 12 May.
These are subject to change as the price action develops.
SHOULD YOU URGENTLY REQUIRE A READING FOR THE LONG TERM, YOU ARE WELCOME TO E-MAIL ME AT LESTER@UNUM.CO.ZA
Short Term (approximately 1 to 10 days)


Medium Term (approximately 2 to 4 weeks)


Lester Davids
Senior Investment Analyst: Unum Capital


Comments