JSE Gold Miners: Relative Position + Rotation + Price Action Models
- Lester Davids

- Apr 19
- 3 min read
Research Notes April 2026 > https://www.unum.capital/post/rapril2026
Trade Local & Global Financial Markets with Unum Capital.
To get started, email tradingdesk@unum.co.za
Disclosure: This note contains images and text that may have been generated using an A.I tool, based on the analyst's proprietary data. This excludes price chart(s) and price action model.

.
JSE Gold Miners Rotation Graph

GOLD FIELDS (GFI)
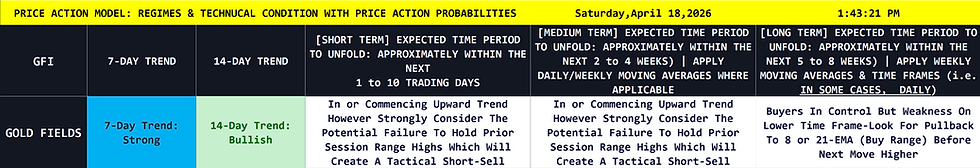
KEY TAKEAWAY: 🟡 WAIT FOR PULLBACK / 🔴 SHORT ON FAILURE | Gold Fields is pushing higher in a structurally bullish regime, but is running into heavy overhead resistance with stretched near-term momentum; traders should strongly consider a tactical short-sell if the price fails at these highs, or wait for a pullback to the moving averages to safely accumulate structural longs.
ANGLOGOLD ASHANTI (ANG)

KEY TAKEAWAY: 🟡 WAIT FOR PULLBACK / 🔴 SHORT ON FAILURE | AngloGold Ashanti is exhibiting an identical structural signature to its sector peers, pressing upward but facing a high probability of exhaustion at range highs; active traders should watch for a rejection to trigger short-sells, or patiently wait for a deeper pullback to moving averages.
DRDGOLD (DRD)

KEY TAKEAWAY: 🟡 WAIT FOR PULLBACK / 🔴 SHORT ON FAILURE | DRDGOLD remains trapped in a choppier, rangebound macro structure compared to its peers; despite strong near-term momentum attempting an upward trend, traders must respect the overhead range bounds and look for short setups on failure, or buy the pullback to the EMAs.
HARMONY GOLD (HAR)

KEY TAKEAWAY: 🔴 SHORT ON FAILURE / 🟢 BUY ON PULLBACK | Harmony Gold has surged aggressively, driving near-term momentum into extreme overbought territory; active traders should execute a 1-2 day mean-reversion short if prior sessions fail to hold, while structural buyers should wait to accumulate on strong bids near the range highs.
THE TACTICAL TRADING GUIDE (PRICE ACTION MODEL): UNCOVER OPPORTUNITIES & ASSESS REWARD-TO-RISK
It helps helps clients determine and shed light on the some of the following:
The CURRENT TECHNICAL POSITION and a PRICE ACTION PROBABILITY for multiple time frames.
Three (3) ‘trading’ time frames are considered: Short Term (1 to 10 days) / Medium Term (2 to 4 weeks) and Long Term (5 to 8 weeks)
Whether the reward-to-risk is attractive for a buy/long position
Whether a share is weak. In this case, wait until the price stabilizes before looking to enter (i.e. want until it stops going down)
Whether aggressive buying is underway. In this case, do not ‘chase’ (do not buy) but instead wait for a pullback to re-enter a buy or an overextension with deteriorating candle structure to sell/short.
Whether a trader can look to buy a pullback into a key moving average (continuation trade)
Whether a share needs to break a range for a new trend to be determined (bullish or bearish)
Whether a traders needs to monitor for a change of character that could lead to a bullish or bearish reversal
Whether a share could start a consolidation phase or before continuing it’s bullish or bearish trend
Whether the upward momentum is slowing (if it's in a bullish phase)
Whether buyers can look to 'phase in' to a position (if it's in a bearish phase)
Whether a share lacks directional bias.
The data set is available in real-time (on request)
The readings are subject to change as the price action develops.
Lester Davids
Senior Investment Analyst: Unum Capital


Comments