
🛜Price Action Model Signals: 5 Real-Time Ideas. Consider Unum Capital As Your Trading Service Provider

+50 Take Profit Opportunities in 15 Weeks: Our Capabilities > https://www.unum.capital/post/capabilities
Free Content: August 2026 > https://www.unum.capital/post/raug2026
Trade Local & Global Financial Markets with Unum Capital.
To get started, email tradingdesk@unum.co.za
NOTE: When Published Intraday (JSE Equities), Prices Are Delayed By 15 Minutes
The price action model is a proprietary non-A.I., excel-based tool.
Here Are 5 Real-Time Ideas Which Helped Clients Manage Risk and Uncover Opportunities.
Idea Number #1: Valterra Platinum > https://www.unum.capital/post/val1208
Idea Number #2: Harmony Gold > https://www.unum.capital/post/har1108
Idea Number #3: Thungela Resources > https://www.unum.capital/post/tga0804
Idea Number #4: Sasol > https://www.unum.capital/post/solrebo
Idea Number #5: Nedbank > https://www.unum.capital/post/ned0603
98% of our content has always been free.
Our research is open, which means that whether you are a client or not, you can access our research, including our trade ideas. If you have been reading our research but use another trading services provider/broker to execute the trades, why not consider moving you trading account to Unum Capital?
THE TACTICAL TRADING GUIDE (PRICE ACTION MODEL): UNCOVER OPPORTUNITIES & ASSESS REWARD-TO-RISK
It helps helps clients determine and shed light on the some of the following:
The CURRENT TECHNICAL POSITION and a PRICE ACTION PROBABILITY for multiple time frames.
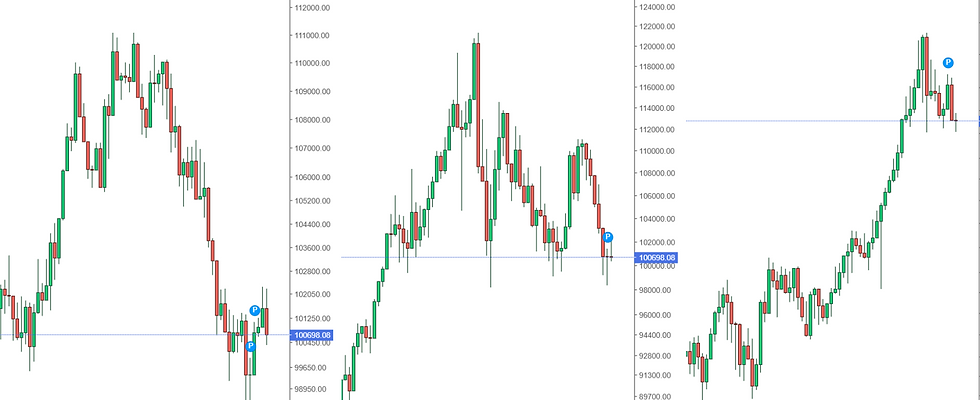
Three (3) ‘trading’ time frames are considered: Short Term (1 to 10 days) / Medium Term (2 to 4 weeks) and Long Term (5 to 8 weeks)
Whether the reward-to-risk is attractive for a buy/long position
Whether a share is weak. In this case, wait until the price stabilizes before looking to enter (i.e. want until it stops going down)
Whether aggressive buying is underway. In this case, do not ‘chase’ (do not buy) but instead wait for a pullback to re-enter a buy or an overextension with deteriorating candle structure to sell/short.
Whether a trader can look to buy a pullback into a key moving average (continuation trade)
Whether a share needs to break a range for a new trend to be determined (bullish or bearish)
Whether a traders needs to monitor for a change of character that could lead to a bullish or bearish reversal
Whether a share could start a consolidation phase or before continuing it’s bullish or bearish trend
Whether the upward momentum is slowing (if it's in a bullish phase)
Whether buyers can look to 'phase in' to a position (if it's in a bearish phase)
Whether a share lacks directional bias.
The data set is available in real-time (on request)
The readings are subject to change as the price action develops.
Lester Davids
Senior Investment Analyst: Unum Capital


Comments