Trading Sibanye Stillwater: Consolidating In Upward Trend; Monitor 8-Week EMA
- Lester Davids

- Jun 20, 2025
- 3 min read
Research Notes For 23 to 27 June > https://www.unum.capital/post/r2327june
Trade Local & Global Financial Markets with Unum Capital.
To get started, email tradingdesk@unum.co.za
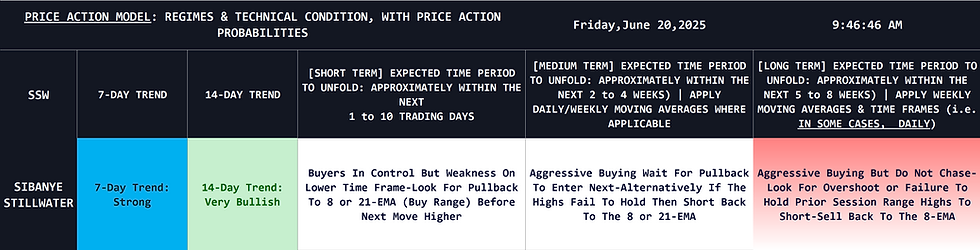
Potential re-test of the 8-week EMA at ~2560c to 2625c (provisional buy re-entry range). For now, a poor reward-to-risk for new buys/longs.

Overall Trading Considerations:
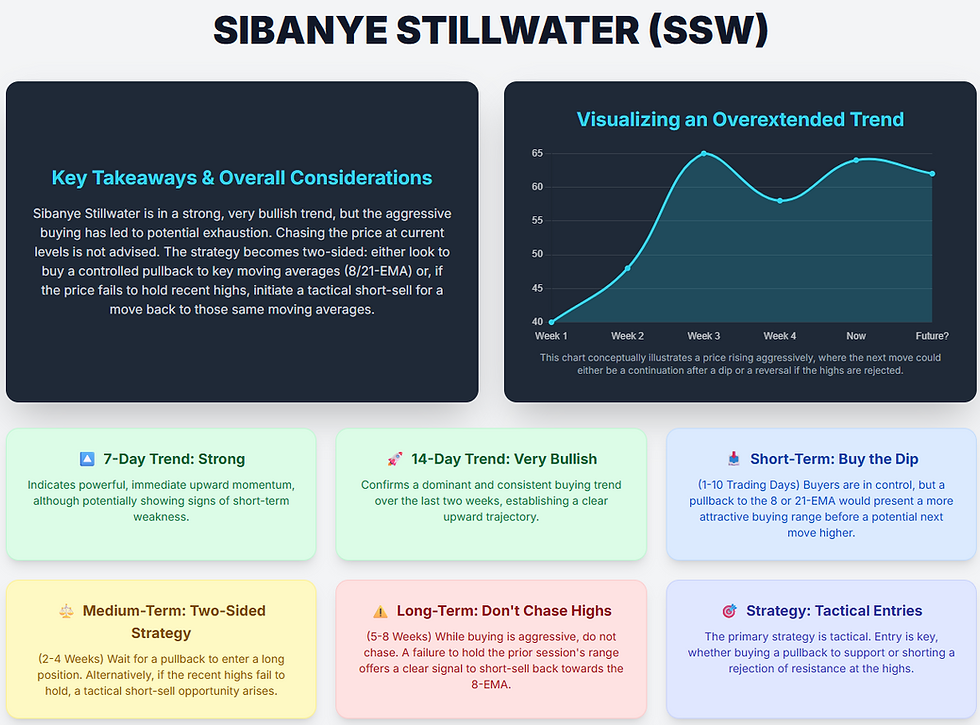
Consistent bullish momentum: Both the short-term (7-day "Strong") and slightly longer short-term (14-day "Very Bullish") trends are strongly positive, supporting upward price action.
Short-term caution: Despite the clear buying pressure, the model advises against chasing the price. It recommends looking for pullbacks as buying opportunities, indicating that the market may be slightly over-extended on lower time frames.
Medium-term aggressive buying: The medium-term view continues the bullish sentiment but also introduces a two-sided approach, suggesting that a failure to sustain new highs could present a short-selling opportunity.
Long-term profit-taking signals: The long-term outlook remains bullish but provides a specific strategy for short-term traders to capitalize on signs of exhaustion, such as a failure to hold above prior highs.
In summary, for Sibanye Stillwater (SSW), the current view is strongly bullish across all timeframes. However, the consistent message is to be disciplined and avoid chasing the market. Traders should wait for pullbacks to enter long positions, while also being alert to specific counter-trend opportunities if the upward momentum shows signs of failing at key levels.
The model points to a general upward trend for the price of SSW.
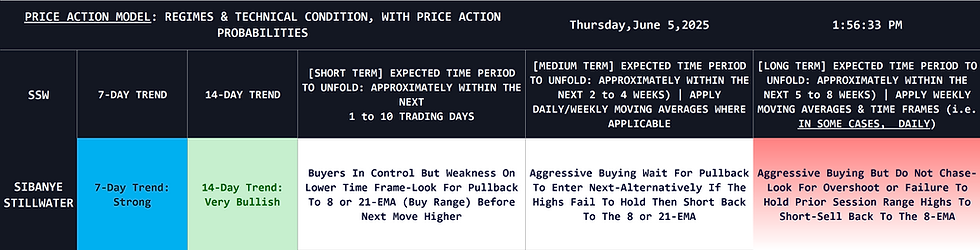
Here's a breakdown of the current price action: The 7-day trend is indicated as "Strong," while the 14-day trend is "Very Bullish."
Comparison: Both the short-term (7-day) and slightly longer short-term (14-day) trends indicate significant upward momentum. This suggests consistent and powerful buying pressure across these timeframes. The "Very Bullish" 14-day trend reinforces the "Strong" 7-day trend, indicating that the recent strength is part of a broader and sustained upward movement.
Multi-Time Frame Trading Trading Approach:
Short Term (Approximately Next 1 to 10 Trading Days): The model notes, "Buyers In Control But Weakness On Lower Time Frame-Look For Pullback To 8 or 21-EMA (Buy Range) Before Next Move Higher."
Approach: While buyers are firmly in control, there's a caution about potential short-term exhaustion. The recommended approach is to not chase the price but instead wait for a dip to the 8 or 21-period Exponential Moving Average (EMA). This area is identified as a "buy range" for entering the market in anticipation of the next upward move.
Medium Term (Approximately Next 2 to 4 Weeks): The model indicates "Aggressive Buying Wait For Pullback To Enter Next-Alternatively If The Highs Fail To Hold Then Short Back To The 8 or 21-EMA."
Approach: The medium-term outlook supports aggressive buying, but again, only on pullbacks. It presents two potential scenarios: The primary strategy is to buy on a dip. Alternatively, if the price attempts to make a new high but fails to hold it, a tactical short (sell) position could be initiated, targeting a move back down to the 8 or 21-EMA.
Long Term (Approximately Next 5 to 8 Weeks): The model states, "Aggressive Buying But Do Not Chase-Look For Overshoot or Failure To Hold Prior Session Range Highs To Short-Sell Back To The 8-EMA."
Approach: The long-term strategy continues the "aggressive buying" theme but with a strict warning not to chase extended moves. It provides a specific counter-trend setup for nimble traders: watch for the price to push above the highs of previous sessions and then fail to stay there. This "overshoot and failure" is a signal to initiate a short-sell trade, targeting a quick pullback to the 8-EMA.
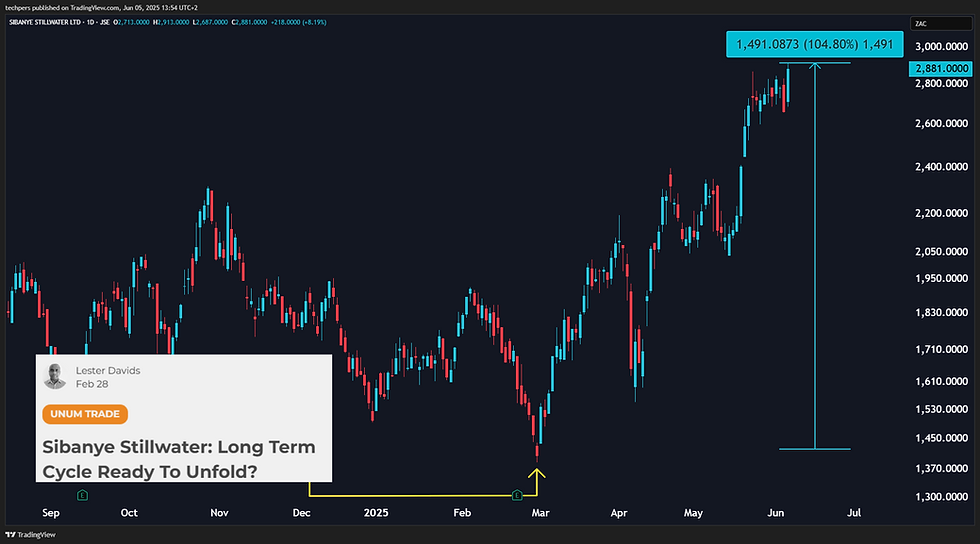
Previous Post (05 June): SSW Running +105% + Current Model Reading
Thus far today, a multi-month high of 2913c
Now trading higher by 105%.

Current Price Action Model Reading
Previous Post: Sibanye Stillwater - Long Term Cycle Ready To Unfold?
SSW Monthly Chart - as of Thursday 27 February at 13h13 #EarlyAccess

Upper Panel: SSW Relative To JSE Top 40 Index (Weekly Chart) - as of Thursday 27 February at 13h10
Lower Panel: Distance vs 200-Week SMA. The ratio is trading 67% below it's 200-week, which is an extreme disconnect from the long term average.

In July we discussed a potential scenario for the share, with the potential path being a drop down to a potential range 1264c to 1353c before a potential rally off the long term channel support. The share dropped to 1400c which was followed by a rally to 2300c. Taking a step back, are we seeing the long term cycle unfolding? The slide below is from report: "Active Trading Plan: Monday 29 July 2024".

Related Post: Sibanye Stillwater: Right Reading, Right Time
Lester Davids
Senior Investment Analyst: Unum Capital


Comments