🛢️Brent Crude Oil
- Lester Davids

- May 1
- 4 min read
Research Notes May 2026 > https://www.unum.capital/post/rmay2026
Trade Local & Global Financial Markets with Unum Capital.
To get started, email tradingdesk@unum.co.za
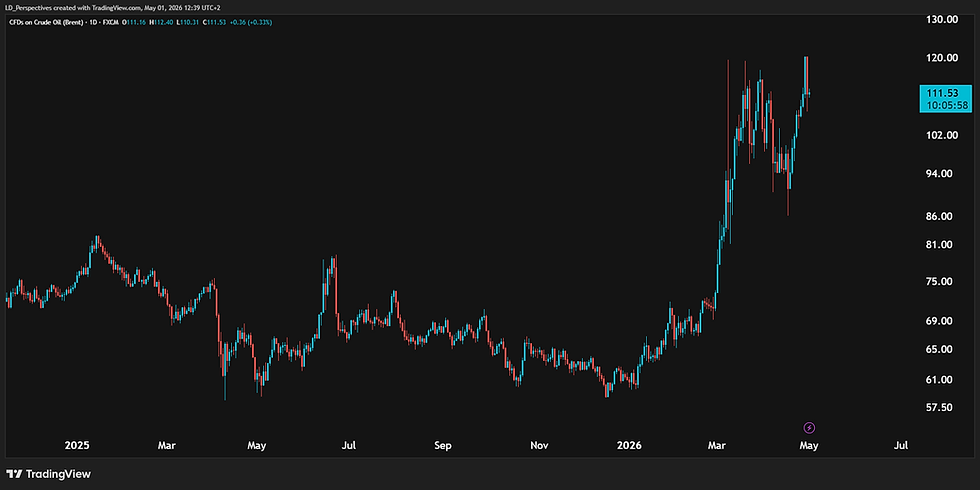
Brent Crude Oil is currently riding a massive structural uptrend, though tactical indicators suggest the most aggressive phase of the rally may be encountering friction. While the macro Mid Term momentum remains firmly anchored in the higher tiers on the Monthly chart, the Daily execution timeframe has cooled significantly. This digestion has allowed the daily pulse to reset toward the Neutral zone, even as the price remains near its local highs. Because the underlying macro cycle is robust but immediate tactical indicators are retreating from "Extreme" levels, the system maintains a 🔻 Sell on Rally signal for tactical traders looking for a mean-reversion flush toward the $95.00 baseline.
CLASSIFICATION: 🔻 Sell on Rally
MOMENTUM PROFILE
Daily Chart (Tactical): Mid Term Momentum is NEUTRAL.
Following the parabolic surge in March 2026, the tactical momentum has retreated from the OVERBOUGHT tier and is currently oscillating in the Neutral band. This indicates a loss of immediate upward velocity despite price remaining elevated.
Weekly Chart (Swing): Mid Term Momentum is STRONG.
On the weekly scale, the momentum is currently positioned in the Strong tier. It has successfully cooled off from the "blow-off" levels seen earlier in the year but remains well above the neutral baseline, confirming that the medium-term structural trend is still in the hands of buyers.
Monthly Chart (Macro): Mid Term Momentum is OVERBOUGHT.
The secular view remains the most extended. The monthly momentum is pinned deep in the OVERBOUGHT tier. Historically, readings at these levels for Brent Crude precede major multi-month consolidations or sharp corrective phases.
CONTRARIAN ASYMMETRY
Distribution Zone (Tactical Short/Reduce): The current $112.00 – $120.00 range remains a high-probability distribution zone. Fading rallies into this overhead resistance is mathematically supported by the extreme monthly overextension.
Accumulation Zone (Contrarian Long): The optimal zone to re-accumulate positions sits significantly lower, in the $85.00 – $92.00 range. This aligns with previous structural resistance that has yet to be tested as new support during this cycle.
CORE THESIS
Brent Crude is currently in a "Macro Overextension" phase. While the Daily Mid Term momentum has reset to neutral, the Monthly Mid Term momentum is redlining at historic exhaustion levels. The statistical probability dictates a "mean-reversion" event to bring the monthly indicators back in line with the $95.00 structural baseline. Strategically, this favors reducing long exposure on any tactical strength toward $115.00+.
WHAT CAN CHANGE?
The current primary thesis is a Parabolic Blow-Off primed for a Bearish Reversal. Here is what would change this outlook:
Technical Triggers (Shift to Sustained Bull): If the price consolidates sideways between $105.00 and $115.00 for several weeks without breaking down, it would allow the momentum indicators to "reset through time" rather than "reset through price." A breakout above $125.00 after such a consolidation would signal a move toward $140.00+.
Fundamental / Macro Triggers: A permanent and severe reduction in global spare capacity or a multi-year geopolitical conflict that removes a major producer from the market would justify these extreme technical levels.
Technical Triggers (Confirmation of Bearish Flush): A daily close below $105.00 would be the first confirmation that the "Blow-Off" has peaked, likely leading to a rapid cascade toward the $90.00 support level.
READY TO TRADE: ACTIONABLE AREAS
For active traders who look to generate cash flow on a continuous basis, determining the ‘next best probability’ level to execute against may be of immense value, specifically by helping to determine the best potential times and levels to commit capital.
The blue and red horizontal lines on the chart represent a next-best-probability buy re-entry range and a next-best-probability sell re-entry range over the short term. The ranges assume no existing position is being held by a trader, while the probabilities are based on several factors, which may include:
Short-term ratings and medium-term regimes
Momentum indicators
Horizontal or diagonal support and resistance
Candle structure
Moving averages and standard deviation
Please note that these are short-term levels and may contrast with medium- and long-term outlooks, which are based on the weekly and monthly charts and are generally more applicable to long-term investors. These levels are subject to change based on market sentiment, subsequent price action, and company/sector-specific or macroeconomic news flow. As always, while the levels are outlined to guide your capital deployment, traders should be prepared to adjust in real-time based on the aforementioned factors.
THE TACTICAL TRADING GUIDE (PRICE ACTION MODEL): UNCOVER OPPORTUNITIES & ASSESS REWARD-TO-RISK
It helps helps clients determine and shed light on the some of the following:
The CURRENT TECHNICAL POSITION and a PRICE ACTION PROBABILITY for multiple time frames.
Three (3) ‘trading’ time frames are considered: Short Term (1 to 10 days) / Medium Term (2 to 4 weeks) and Long Term (5 to 8 weeks)
Whether the reward-to-risk is attractive for a buy/long position
Whether a share is weak. In this case, wait until the price stabilizes before looking to enter (i.e. want until it stops going down)
Whether aggressive buying is underway. In this case, do not ‘chase’ (do not buy) but instead wait for a pullback to re-enter a buy or an overextension with deteriorating candle structure to sell/short.
Whether a trader can look to buy a pullback into a key moving average (continuation trade)
Whether a share needs to break a range for a new trend to be determined (bullish or bearish)
Whether a traders needs to monitor for a change of character that could lead to a bullish or bearish reversal
Whether a share could start a consolidation phase or before continuing it’s bullish or bearish trend
Whether the upward momentum is slowing (if it's in a bullish phase)
Whether buyers can look to 'phase in' to a position (if it's in a bearish phase)
Whether a share lacks directional bias.
The data set is available in real-time (on request)
The readings are subject to change as the price action develops.
Lester Davids
Senior Investment Analyst: Unum Capital


Comments