Spot Platinum: Multi-Time Frame Outlook, Risks & Probabilities
- Lester Davids

- Apr 9
- 4 min read
Research Notes April 2026 > https://www.unum.capital/post/rapril2026
Trade Local & Global Financial Markets with Unum Capital.
To get started, email tradingdesk@unum.co.za
Current Phase: 🟢 Buy on Pullback / Trend Continuation
Next Best-Probability Phase: 🟢 Bullish Expansion / Breakout Attempt
Strategic Overlay: Trend Continuation.
Momentum Profile: The multi-timeframe momentum profile reveals a constructive, synchronized bullish alignment following a healthy structural reset.
Monthly (Macro): The macro momentum suite remains in a dominant secular uptrend. It is currently undergoing a minor digestion phase to work off peak froth without damaging the underlying trend.
Weekly (Structural): After a recent vertical peak and subsequent markdown, the fast weekly oscillators executed an orderly cooling cycle into oversold territory. They have now definitively arrested their decline and are hooking aggressively upward, signaling the structural pullback is complete.
Daily (Tactical): The daily fast oscillators previously washed out but have printed a violent V-shaped recovery. They have crossed cleanly above the neutral midline and are surging, actively dragging the slower tiers upward.
Synthesis: This is a textbook multi-timeframe structural buy setup. The macro trend is dominant, the structural trend has successfully reset and fired a fresh long signal, and tactical momentum is accelerating.
Structural Analysis & Tactical Bias: Evaluating the broader macro context, the asset recently engineered a massive multi-year structural breakout. The tape peaked near ~$2,800 and executed a sharp corrective markdown toward the ~$1,600 support floor. Isolating the immediate daily price action, the tape fiercely defended that zone, printing a definitive higher-low and a sharp recovery to trade currently near ~$1,985. Given the multi-timeframe alignment, the tactical bias leans confidently toward 🟢 Buy on Pullback / Trend Continuation.

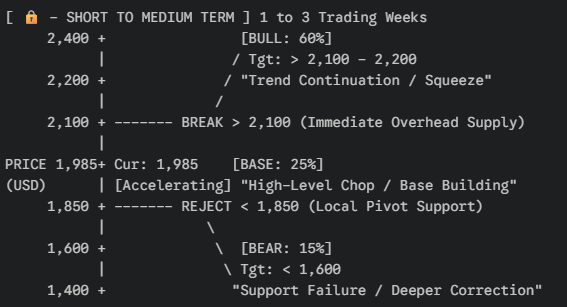
Key Support & Resistance Levels: Immediate overhead supply is concentrated near ~$2,100 to ~$2,200. If cleared, the primary target sits at the recent structural peak near ~$2,800. Immediate structural support rests firmly at the ~$1,850 intraday higher-low pivot. The ultimate macro floor remains the recent capitulation bounce level at ~$1,600.
Next Candle Probability: The current price action aligns with Scenario 17: 🟢 Bullish Continuation / Violent Rebound. The daily structure shows strong consecutive green expansion candles emerging from validated support. Because fast oscillators are surging, the highest probability outcome for the next sequence of daily candles is bullish follow-through targeting the ~$2,100 resistance block.
Primary View Invalidation: To invalidate this view, sellers would need to abruptly halt the current surge and force a decisive weekly close below the ~$1,850 local floor. This would confirm a bull trap, destroy the nascent weekly momentum hook, and initiate a deeper secular correction toward $1,600.
The Next 10 Days: Market participants should anticipate a steady, high-velocity grind toward the ~$2,100 to ~$2,200 supply zone. Minor intraday pullbacks toward ~$1,920 should be viewed as algorithmic base-building rather than trend reversals.
Tactical Risk Assessment: Buying vs. Selling
What's the risk of buying now? You are buying into an extended daily bounce that is nearing overbought status. Vertical moves occasionally require a localized "breather" to form a high-level flag before taking out major resistance. You risk a brief drawdown toward ~$1,900 to build that structure.
What Can Change? If institutional buyers relentlessly press the tape and force a high-volume daily close above ~$2,100 without allowing a pullback, it confirms a runaway momentum squeeze, neutralizing the risk of a near-term dip.
What's the risk of selling now? You are stepping in front of a synchronized macro wave. The weekly chart has completed its reset and is firing a fresh structural long signal. You risk being "run over" as the tape catches a fresh macro bid and slices through local ceilings.
What Can Change? If the daily price structure reaches ~$2,100 and prints a massive, high-volume bearish rejection wick while fast momentum plateaus, it would mechanically confirm localized exhaustion and a shift to sideways chop.
Timeframe Confluence & Forecasting (WCL Model)
1-Month Forecast (🟢 Bullish): Driven by 60% Daily / 30% Weekly / 10% Monthly. Daily oscillators are surging upward, supported by the weekly hook. We project tactical upward repricing over the next 30 days targeting the ~$2,100 - ~$2,200 block.
3-Month Forecast (🟢 Strong Bullish): Driven by 20% Daily / 50% Weekly / 30% Monthly. With the weekly cooling cycle completed and hooking up from deep levels, the structural trend is primed for continuation toward ~$2,400.
6-Month Forecast (🟢 Secular Bullish): Driven by 10% Daily / 20% Weekly / 70% Monthly. The monthly timeframe dominates. Because the macro oscillators have successfully digested peak froth, we project significantly higher prices six months out as the primary secular bull trend resumes.
Forecast Projection Breakdown: With momentum accelerating across all timeframes, the probability distribution is heavily skewed toward immediate continuation.
The Bullish Scenario (60% Probability): The vertical squeeze persists. Buyers absorb all minor profit-taking and drive the price relentlessly toward ~$2,200 without allowing a deep pullback.
The Base/Neutral Scenario (25% Probability): The asset hits a localized psychological wall at ~$2,000 and enters a high-level flag, grinding sideways to lower toward ~$1,900 to allow the moving averages to catch up.
The Bearish Scenario (15% Probability): The breakout is a sophisticated trap. A sudden macro shock forces a high-volume reversal that crashes the price back into the ~$1,700 range.
Lester Davids
Senior Investment Analyst: Unum Capital


Comments