☰ Trading Watchlist
- Lester Davids

- Feb 10
- 3 min read
Research Notes February 2026 > https://www.unum.capital/post/rfeb2026
Trade Local & Global Financial Markets with Unum Capital.
To get started, email tradingdesk@unum.co.za
Premium Content.
Master Tactical Action Plan
Buy 🔒, 🔒, or 🔒 on a pullback; they show strong R:R potential in the Weakening quadrant.
Buy 🔒 or 🔒 on a pullback to capture continuation in high-velocity technology leaders.
Buy 🔒 or 🔒 on a pullback; sellers appear exhausted in the Lagging/Weakening phases.
Buy 🔒 or 🔒 on a pullback as they test a statistical floor in the Lagging quadrant.
Buy 🔒 or 🔒 on a pullback; their high R:R indicates significant upside from the Industrials sector.
Buy 🔒 or 🔒 on a pullback to ride the gold momentum while maintaining a tight stop.
Buy 🔒 or 🔒 on a pullback as they emerge from the 'Improving' quadrant with fresh momentum.
Buy 🔒 or 🔒 on a pullback as they represent high-conviction reversal plays at a statistical floor.
Buy 🔒 or 🔒 on a pullback to capitalize on the capitulation bounce in the Financials sector.
If 🔒 or 🔒 spikes higher from here, they enter a confirmed sell range for a shorting opportunity due to exhaustion.
If 🔒 or 🔒 trades higher, they hit a 'NO' buy zone, providing a tactical shorting opportunity.
If 🔒 or 🔒 spikes from current levels, they move deeper into the 'Overextended' zone for a potential short.
If 🔒 or 🔒 spikes from here, they hit a 'Sell on Rally' trap, ideal for tactical shorting.
If 🔒 or 🔒 trades higher, the vertical thrust enters a 'NO' buy zone, signaling a shorting chance.
If 🔒 or 🔒 trades higher, they hit a 'Momentum Wall,' making them candidates for a short entry.
If 🔒 or 🔒 spikes higher, they enter an 'Avoid Chasing' zone, perfect for a contrarian short.
If 🔒 trades higher, it approaches a sell/reduce range where momentum is likely to stall.
If 🔒 or 🔒 spikes higher, it creates a 'Sell on Rally' shorting opportunity near resistance.
If 🔒 or 🔒 spikes into extreme overextension, they provide a low-risk sell/reduce opportunity.
Watch for a False Breakdown in 🔒 or 🔒: If price dips below the recent support level but closes back above it within 1–2 sessions, it creates a high-conviction Long/Buy opportunity (Bear Trap).
Watch for a False Breakout in 🔒 or 🔒: If price spikes above current multi-year resistance on low volume only to fail and close back within the range, it creates a high-conviction Short opportunity (Bull Trap).
Watch for a False Breakdown in 🔒 or 🔒: A brief "stop-hunt" below the 200-day moving average that is immediately reclaimed signals a strong Long entry as weak hands are flushed out.
Watch for a False Breakout in 🔒: A vertical move into record territory that fails to attract institutional volume on the "retest" is a major Short signal as the breakout lacks fuel.
Watch for a "Pin Bar" Reversal in 🔒: If a move to new lows creates a long lower wick (rejection), it confirms a false breakdown and provides a precise Buy entry with a stop just below the wick.
Identify a "Bullish Engulfing" in 🔒: If a small red candle is followed by a large green candle that completely covers it, the Improving phase is confirmed—Buy Now.
Execute a "Short" on 🔒 if a Shooting Star forms: A small body with a very long upper wick at resistance indicates a False Breakout and immediate trend reversal.
Long 🔒 on a Bull Flag breakout: If the stock consolidates sideways after a 5% gain and then breaks the upper trendline, enter for the Continuation trade.
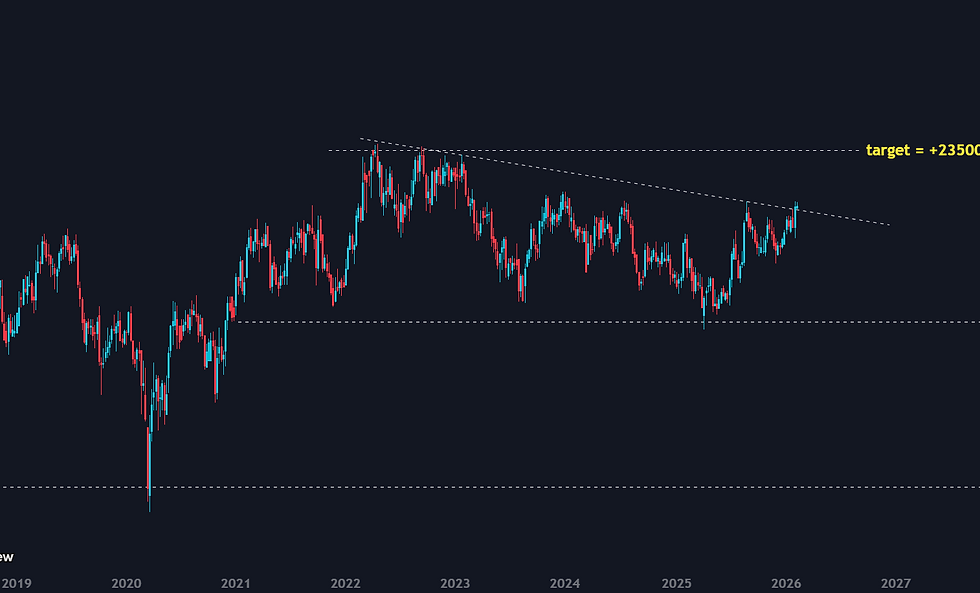
Short 🔒 on a Double Top: If price tests the 79,500 target twice and fails to break through, it confirms institutional selling—Exit Longs/Enter Shorts.
Buy 🔒 on a Volume Climax: If the stock drops 5% on record volume but finishes the day green, it signifies Capitulation and the end of the Lagging phase.
Lester Davids
Senior Investment Analyst: Unum Capital


Comments